
Introduction
Managing Biosimilar Development Cost and Timeline when outsourcing to a Contract Development and Manufacturing Organization (CDMO) generally requires an investment of $100 million to $250 million over 6 to 8 years under traditional clinical development frameworks. However, some industry guides estimate that total expenditures can reach as high as $300 million and extend over 7 to 12 years, depending on the complexity of the molecule. Nevertheless, regulatory reforms introduced during 2025–2026 by the U.S. Food and Drug Administration (FDA), the European Medicines Agency (EMA), and Health Canada have created opportunities for developers to waive routine Phase III comparative efficacy trials for well-characterized candidates. These changes can reduce development expenses by approximately $24 million for each waived efficacy study (or $25 million per program according to peer-reviewed modeling), generate savings of up to $20 million through streamlined pharmacokinetic (PK) bridging, and shorten overall development schedules by approximately 1.5 years. Despite these clinical cost reductions, an industry estimate from Neuland Labs cautions that initial CDMO Request for Proposal (RFP) quotations may represent only 60–70% of the actual total cost of ownership once capacity reservation fees, platform royalties, analytical method transfers, and regulatory pass-through charges are considered.
For biopharma sponsors preparing to outsource a biosimilar development program, accurate budgeting requires redirecting capital from unnecessary late-stage patient trials toward early-stage analytical comparability, process validation, and clearly defined contractual protections. Based on peer-reviewed net present value (NPV) models, regulatory Chemistry, Manufacturing, and Controls (CMC) benchmarks, and operational quality standards followed by accredited analytical and biosimilar development partners such as ResolveMass Laboratories Inc. (a Health Canada GMP Drug Establishment Licence holder, an FDA-registered facility under FEI 3042696771, and an ISO 9001:2015 certified laboratory), this guide examines the specific costs, timelines, and less-visible contractual risks that should be considered when preparing a CDMO budget.
Explore the analytical support available for biosimilar development:
Biosimilar Characterization Services
Share via:
Quick Summary:
- Baseline cost and time: Taking a biosimilar through a CDMO has traditionally cost about $100–250 million over 6–8 years. Clinical work makes up roughly 57% of that and CMC about 38%.
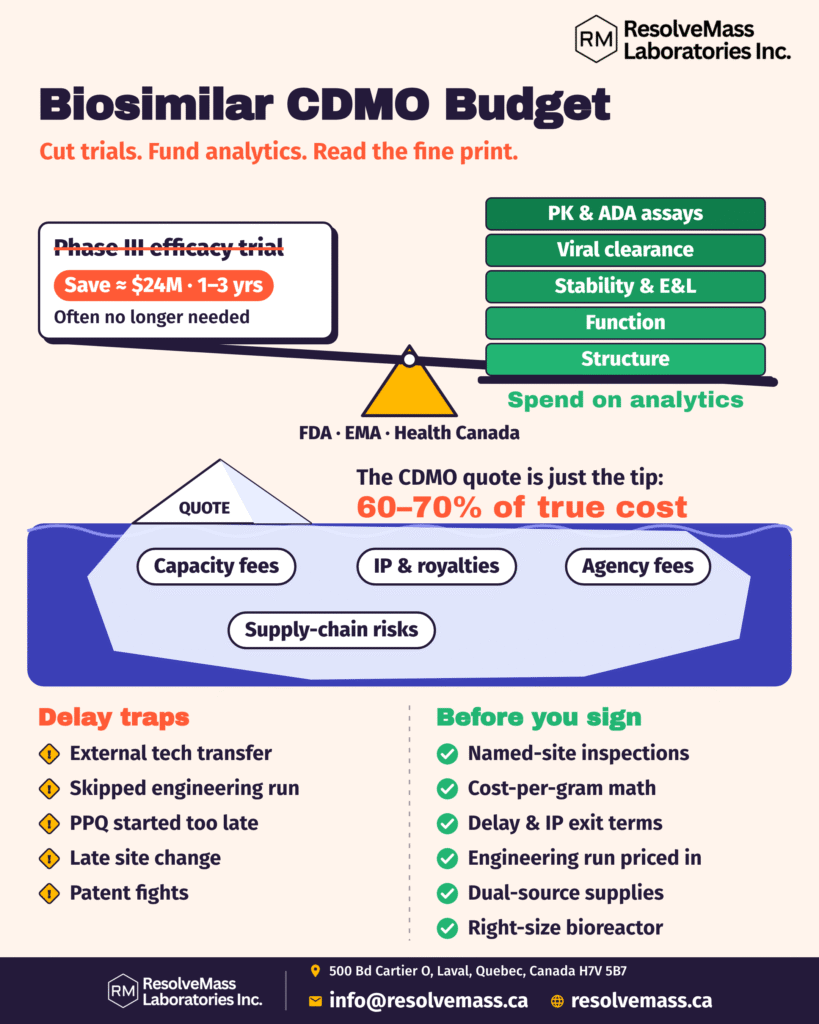
- 2025–26 regulatory shift: The FDA, EMA and Health Canada now accept strong analytical data plus a PK study in place of routine Phase III efficacy trials for well-characterized molecules. Each waived trial saves about $24 million and 1–3 years, and streamlined PK testing can save up to about $20 million.
- Budget moves to analytics: To qualify for a waiver, sponsors must invest early in five areas:
- orthogonal structural profiling (HRMS, NMR, HDX-MS)
- precise functional bioassays
- stability and E&L studies
- viral clearance
- validated PK/ADA assays
- Hidden CDMO costs: The initial RFP quote may cover only 60–70% of the true cost. Four other layers add to it:
- capacity commitments, such as take-or-pay terms that can raise the cost per used batch by 28.6–71.4%
- IP royalties
- regulatory pass-through fees
- supply-chain safeguards
- Bioreactor choice: Stainless steel lowers the cost per gram for high-volume products. Single-use systems offer faster changeovers and lower upfront capital, so the scale should match realistic market demand.
- Delay traps:
- External tech transfers add about 5.8 months.
- Skipping a ~$300K engineering run can put a $1.5M PPQ batch at risk.
- PPQ should finish 12–18 months before the BLA.
- Late site changes and patent disputes can delay launch.
- Before signing: Sponsors should check the following:
- the inspection record of the named manufacturing site
- the assumptions behind the cost-per-gram figure
- delay and IP exit terms
- whether engineering runs and viral clearance are in the base price
- dual sourcing of critical materials
- deviation escalation timelines in the Quality Agreement
Biosimilar Development Cost and Timeline Benchmarks: Traditional vs. 2026 Tailored Pathways
Under traditional regulatory frameworks, peer-reviewed financial models allocate approximately 57% of total biosimilar development expenditure ($80–$120 million) to clinical development and 38% to CMC activities. The CMC portion is divided between 18% ($25–$35 million) for process development and 20% ($30–$45 million) for manufacturing setup and validation, with the complete development program extending across a 6- to 8-year period. Under the tailored regulatory pathways introduced during 2025–2026 by the FDA, EMA, and Health Canada, the removal of routine Phase III comparative efficacy studies shifts a greater proportion of the development budget toward high-resolution CDMO analytical characterization and process comparability.
How the 2025–2026 FDA and EMA Reforms Reshape Biosimilar Development Cost and Timeline
Recent regulatory developments are reducing Biosimilar Development Cost and Timeline by replacing confirmatory Phase III patient trials with comprehensive analytical assessments and human PK equivalence evaluations. This approach can eliminate approximately $20 million to $28 million in direct efficacy trial expenses ($25 million or an 18% reduction in the overall program cost according to peer-reviewed mAb modeling) while reducing the total development period by approximately 1.5 years, representing a 21% improvement in development speed.
Between October 2025 and mid-2026, major regulatory authorities increasingly adopted an analytical-first approach to biosimilar approval. On March 9, 2026, the FDA released its draft guidance, New and Revised Draft Q&As on Biosimilar Development and the BPCI Act (Revision 4), and withdrew its April 2015 Scientific Considerations guidance. According to FDA estimates, eliminating unnecessary clinical PK testing can reduce PK study expenses by as much as 50% (approximately $20 million). This is possible when scientifically justified non-U.S.-licensed comparator data can be used without requiring mandatory three-way PK bridging studies. In addition, waiving comparative efficacy studies can save approximately $24 million per study. During the same month, the EMA’s Committee for Medicinal Products for Human Use (CHMP) adopted its Reflection paper on a tailored clinical approach in biosimilar development (EMA/CHMP/BMWP/60916/2025). Canada also moved toward eliminating routine Phase III trial requirements in June 2026.
A peer-reviewed NPV evaluation published in Biologics: Targets and Therapy in February 2026 demonstrates how these regulatory waivers influence CDMO investment decisions for monoclonal antibodies (mAbs). According to the evaluation, removing Phase III trial requirements improves risk-adjusted NPV by $25 million, equivalent to a 25–29% increase, while reducing the minimum viable reference-product peak sales threshold from $300 million to $250 million. This makes mid-market biologics with peak sales potential of $600 million to $2 billion more commercially attractive for biosimilar development. Although an opinion commentary published in The Center for Biosimilars suggests that clinical trial waivers could eventually reduce simplified biosimilar development programs to $5 million to $10 million, peer-reviewed financial models indicate that complete de novo mAb development programs still require investments exceeding $100 million. This is because cell line engineering, multi-lot reference characterization, Process Performance Qualification (PPQ), and human PK/PD bridging remain essential development activities.
| Strategic Parameter | Traditional 351(k) / MAA Pathway | 2026 Tailored / Waiver-Eligible Pathway | Budget & Schedule Impact for CDMO Programs |
|---|---|---|---|
| Primary Basis of Similarity | Stepwise analytical evaluation followed by Phase III confirmatory efficacy trials | Early-stage orthogonal analytics, functional assays, and human PK/PD assessments | Higher initial analytical expenditure with lower downstream clinical supply requirements |
| Direct Phase III CES Cost | $20–$28 million per study ($70–$98 million for the complete Phase III package) | Waived for well-characterized molecules with low residual uncertainty | Saves approximately $24 million according to FDA estimates (approximately $25 million or an 18% overall reduction in mAb modeling) |
| Clinical PK Study Cost | $9–$13 million, frequently involving three-way comparator bridging | Streamlined approach; non-U.S. comparator data may be accepted when scientifically justified | Up to 50% savings in PK expenses (approximately $20 million according to FDA estimates) and reduced reference product sourcing requirements |
| Total Development Window | 6–8 years (potentially extending to 8.5–9 years for complex mAbs) | Approximately 1.5 years (21%) shorter than the traditional 6–8-year baseline | Launching 12–18 months earlier can generate substantial first-mover market share |
| Minimum Viable RP Peak Sales | Approximately $300 million annually | Approximately $250 million annually | Makes $600 million–$2 billion mid-market biologics more attractive for CDMO development capacity |
Phase-by-Phase Biosimilar Development Cost and Timeline Breakdown for CDMO Outsourcing
According to published peer-reviewed NPV modeling, a standard outsourced mAb development program requires approximately $140 million to $208 million across four major expenditure categories: Process Development ($25–$35 million), Manufacturing Setup and Validation ($30–$45 million), Clinical Development ($80–$120 million before regulatory waivers), and Regulatory Filing ($5–$8 million). CMC execution remains a critical component of the development pathway for at least two years.
When development activities are outsourced to a CDMO, capital expenditure is generally distributed across milestone-based payments covering cell line construction, engineering runs, GMP clinical supply campaigns, and commercial PPQ batches. Actual development budgets can differ considerably depending on therapeutic complexity. Peer-reviewed case studies estimate that an oncology mAb program may cost $140 million over 7 years, with a 70% probability of success and a commercial cost of goods sold (COGS) of 28%. An immunology mAb program may require $165 million over 8 years, with a 65% probability of success and 32% COGS. A more complex mAb program involving a novel formulation may require approximately $190 million over 8.5 years, with a 65% probability of success. Across commercialized biosimilars, steady-state COGS generally accounts for 25–35% of revenue.
| Development Phase & CDMO Workstream | Key Budget Line Items | Typical Budget Range | Share of Traditional Cost | Representative Milestone Timing |
|---|---|---|---|---|
| Process Development (CMC Foundation) | Cell line engineering ($8–$12M), RP characterization ($3–$5M), comparability ($5–$7M), process characterization ($5–$7M), analytical method development/validation ($4–$6M) | $25–$35 million | 18% | From pre-IND (3–6 months before submission) through End-of-Phase 2 lock (Months 24–36) |
| Manufacturing Setup & Validation | Pilot plant setup ($10–$15M), PPQ validation batches ($8–$12M), facility qualification ($5–$8M), analytical validation ($4–$6M), stability testing ($3–$4M) | $30–$45 million | 20% | Commercial-scale lots during Months 36–60; PPQ campaign 12–18 months before BLA |
| Phase I Clinical & Bioanalytical | Clinical PK/PD execution ($6–$8M), GMP clinical supplies ($2–$3M), ICH M10 bioanalytical testing ($1–$2M) | $9–$13 million | Part of the 57% clinical total | Post-IND (Month 0 plus 30-day review); 6–12 months of execution |
| Phase III Confirmatory (If Not Waived) | Complete package ($70–$98M: execution $50–$70M, supplies $15–$20M, bioanalytical testing $5–$8M, data $3–$5M); CES alone approximately $20–$28M | $70–$98 million (full package) | Part of the 57% clinical total | Trial duration of 1–3 years; waived in many 2026 programs |
| Regulatory Dossier & Registration | CTD dossier compilation ($2–$3M), major-market registration fees ($1–$2M), agency interactions ($1–$2M), post-approval commitments ($1M) | $5–$8 million | 5% | Pre-BLA 3–6 months before submission; FDA review approximately 12 months (6 months for priority review); EMA 210 active days |
In comparison, sponsors can avoid extensive de novo CDMO development by licensing an already approved finished product dossier. This approach can reduce regional registration timelines to approximately 1 to 2 years. However, the shorter development pathway involves a trade-off: sponsors generally face lower upfront R&D risk but may have reduced commercial margins and limited flexibility over formulation-related decisions.
Analytical Characterization and CMC Budgeting Under a Waiver-First Strategy
Obtaining a Phase III waiver under the FDA and EMA regulatory frameworks introduced in 2026 requires sponsors to allocate a substantial portion of their initial development budget to orthogonal analytical and functional characterization. This is particularly important because advanced analytical techniques can identify and evaluate structural variations with approximately 1–2% precision, offering considerably greater sensitivity than the 15–20% equivalence margins commonly associated with clinical efficacy trials.
An August 2025 report from the U.S. Department of Health and Human Services (ASPE) indicates that, among 246 biosimilar projects monitored across the United States, Europe, and Japan, only 53% of candidates successfully progress beyond the preclinical development stage. Early-stage program failures frequently occur when cell line clones cannot adequately reproduce the originator’s Critical Quality Attributes (CQAs). These attributes include glycosylation patterns, charge heterogeneity, disulfide bonding, and aggregation propensity. Such differences can arise when sponsors do not invest sufficiently in early reference product (RP) characterization. Under Tier 1 statistical equivalence criteria, sponsors must obtain and analyze multiple RP lots manufactured across different markets and production periods to establish the natural variability range of the originator product.
Review the technical considerations involved in biosimilar cell line development:
Cell Line Development for Biosimilars
To prepare a waiver-ready Module 3 package that can withstand FDA and EMA regulatory scrutiny without initiating additional bridging studies, sponsors should ensure that their CDMO and analytical budgets include the following five technical deliverables:
Orthogonal Physicochemical & Structural Profiling
High-resolution mass spectrometry (HRMS/LC-MS), hydrogen-deuterium exchange MS (HDX-MS), multidimensional nuclear magnetic resonance (NMR), size-exclusion chromatography with multi-angle light scattering (SEC-MALS), and capillary isoelectric focusing (cIEF) should be incorporated to evaluate higher-order structure and post-translational modifications.
Understand how critical quality attributes influence biosimilar comparability:
Critical Quality Attributes (CQAs) in Biosimilars
High-Precision Functional & Kinetic Bioassays
Surface plasmon resonance (SPR), bio-layer interferometry (BLI), and cell-based potency assays, including ADCC and CDC, should be performed with coefficients of variation below 5%. These results should be evaluated against the 15–30% variability commonly observed in inflammatory clinical endpoints.
Explore the role of proteomics in analytical biosimilar assessment:
Proteomics Approach for Biosimilars
Impurity, Degradation & Container Closure Studies
The analytical program should include ICH Q1A/Q1B/Q5C stability protocols, forced degradation studies, extractables and leachables (E&L) testing, and USP / ICH Q3C residual solvent analysis.
Review the analytical approaches used to evaluate impurities in biosimilar products:
Impurity Profiling of Biosimilars
Viral Clearance Validation
Viral clearance studies must be completed before releasing Phase III or pivotal GMP material. According to an industry playbook from DrugPatentWatch, these studies may cost approximately $200,000 to $500,000 each.
ICH M10 Bioanalytical & Immunogenicity Assays
Validated PK/PD and anti-drug antibody (ADA) assays are necessary to establish the relationship between analytical similarity and human PK equivalence.
Collaborating with an accredited analytical laboratory that performs these activities under an integrated quality management system can help sponsors avoid fragmented vendor handoffs. For example, ResolveMass Laboratories Inc. offers HRMS, quantitative NMR, forced degradation, and E&L testing programs that support analytical characterization and CMC development activities before important End-of-Phase 2 and Pre-BLA milestones.
Explore an integrated analytical package for biosimilar regulatory submissions:
End-to-End Biosimilar Analytical Package for a Regulatory Submission
The Five-Layer CDMO Pricing Stack and Hidden Contract Costs
Initial CDMO batch quotations rarely reflect the final expenditure of a complete development program. This happens because Layer 1 service fees generally exclude four additional contractual components: capacity commitments, platform intellectual property (IP), regulatory pass-through expenses, and trade or supply-chain safeguards. These additional costs help explain why an industry estimate from Neuland Labs suggests that initial RFP quotations may represent only 60–70% of the actual total cost of ownership.
Applying the five-layer pricing stack framework developed by DrugPatentWatch when reviewing a CDMO proposal can help finance and CMC teams identify expenses that may otherwise remain hidden in Master Services Agreements (MSAs), Quality Agreements, and IP schedules. Evaluating these contractual components before signing an agreement provides greater visibility into the financial obligations associated with outsourced development and manufacturing.
Navigating CDMO Billing Models and Reservation Penalties
Layer 1 covers direct service billing arrangements, including Fee-for-Service (FFS), Full-Time Equivalent (FTE), Time-and-Materials (T&M), and open-book cost-plus models. Layer 2 involves capacity commitment provisions, which can increase the effective cost per batch actually used by approximately 28.6% to 71.4% when clinical delays result in manufacturing slot cancellations.
Before manufacturing activities begin, CDMOs frequently require substantial non-refundable financial commitments. For example, a DrugPatentWatch contract review identifies a September 2022 agreement in which a sponsor committed $7.2 million toward capacity reservations and prepaid another $5.0 million for raw materials. Neither amount was refundable if the MSA was not finalized. During program execution, non-cancellable take-or-pay provisions can create substantial financial penalties when development schedules change. In a DrugPatentWatch scenario involving 12 reserved manufacturing slots, a sponsor uses only 7 batches, with a base expenditure of $14.00 million for those 7 batches, equivalent to $2.00 million per batch. Under take-or-pay provisions, the effective cost per batch actually used increases by 71.4%, reaching $3.43 million. Even when the agreement permits resale credits for cancelled slots, assuming 3 of the 5 unused slots are resold, the effective cost per used batch still increases by 28.6%, reaching $2.57 million.
Layer 3, which covers IP and platform economics, can create additional long-term financial obligations and reduce commercial margins. Major biologics CDMOs increasingly structure service agreements around downstream economic participation. WuXi Biologics’ H1 2026 backlog of $25.1 billion included $12.6 billion in service backlog and $12.4 billion, representing 49.4%, in potential milestone fees across more than 50 programs eligible for milestone-based payments and royalties. Certain agreements may also require annual per-product payments when a sponsor transfers a CDMO-licensed cell line to another manufacturer. In other cases, the CDMO may retain ownership of foreground IP associated with process improvements. These provisions can create vendor lock-in and restrict the sponsor’s ability to establish dual-source commercial manufacturing arrangements.
| Price Stack Layer | Common Contract Mechanism | Budget Risk to Biosimilar Sponsor | Recommended Negotiation Guardrail |
|---|---|---|---|
| Layer 1: Direct Service Fees | FFS (fixed scope), FTE (dedicated staff), T&M, or Cost-Plus | Changes in FFS scope can result in expensive change orders, while FTE/T&M arrangements transfer productivity-related risks to the sponsor | Clearly define change-order triggers and make FTE renewals dependent on CMC milestones |
| Layer 2: Capacity Commitments | Pre-MSA deposits, take-or-pay provisions, or near-full cancellation fees | Unused manufacturing slots increase the effective cost of used batches by approximately 28.6% to 71.4% | Negotiate flexible deferral periods and mandatory resale credit provisions |
| Layer 3: IP & Platform Terms | Cell line licenses, sales royalties, milestone payments, and third-party switching fees | Long-term margin reduction, in addition to 30–40% biosimilar discounts, and potential vendor lock-in | Secure upfront buyout options for cell line licenses and ensure sponsor ownership of foreground IP |
| Layer 4: Regulatory Pass-Throughs | BsUFA 3 BPD fees, facility/DMF fees, and Pre-License Inspection (PLI) support | Increasing agency fees, such as the 15.6% rise in FDA DMF pass-through fees between FY25 and FY27, and unplanned PLI preparation expenses | Set limits on administrative markups applied to user fees and include PLI readiness in the base SOW |
| Layer 5: Trade & Supply Chain | Single-source resins/media, single-use kits, and cold-chain logistics | Manufacturing interruptions caused by raw material shortages or temperature excursions (-80 °C or 2–8 °C) | Require dual-sourced consumables and maintain a minimum 3-month safety stock of critical materials |
Stainless Steel vs. Single-Use Bioreactors: Budgeting Commercial COGS
Choosing between 2,000 L single-use manufacturing trains and stainless steel bioreactors ranging from 2,000–20,000 L can significantly influence whether a commercial biosimilar program achieves the expected COGS benchmark of 25–35%. Factors such as production titer, downstream yield, resin lifetime, and facility utilization generally have a greater influence on overall manufacturing economics than relatively small reductions in individual batch fees.
In markets where biosimilars are introduced with price discounts of approximately 30–40%, and sometimes as high as 70% in tender-driven European markets, selecting a bioreactor scale that corresponds to realistic peak market demand is essential for maintaining long-term commercial profitability.
| Bioreactor Criterion | Stainless Steel (2,000–20,000 L) | Single-Use Trains (Up to 2,000 L) | Budgetary Implication for Sponsors |
|---|---|---|---|
| Scale Ceiling per Batch | Very high capacity, with individual batches reaching 10,000 L or more | Limited to approximately 2,000 L per bioreactor; production capacity can be increased through parallel trains | Stainless steel systems can reduce manufacturing costs per gram for high-volume blockbuster products |
| Changeover & Cleaning | Requires multi-day cleaning and sterilization cycles, along with product-specific cleaning validation | Changeovers take hours, while disposable assemblies help minimize cross-contamination risks | Single-use systems enable faster clinical campaign turnaround and greater flexibility for multi-product manufacturing |
| Capital & Build Lead Time | Requires substantial upfront capital and facility construction over multiple years | Lower capital requirements, with modular manufacturing capacity that can be expanded in stages | CDMOs can provide faster manufacturing slot access without requiring multi-year custom capital expenditure commitments |
| Recurring Consumables | Lower recurring consumable expenditure per batch | Higher recurring expenditure for single-use bags, tubing sets, and filters | Single-use systems can increase variable COGS per gram and exposure to consumable kit price inflation |
Critical-Path Timeline Risks That Trigger Budget Overruns
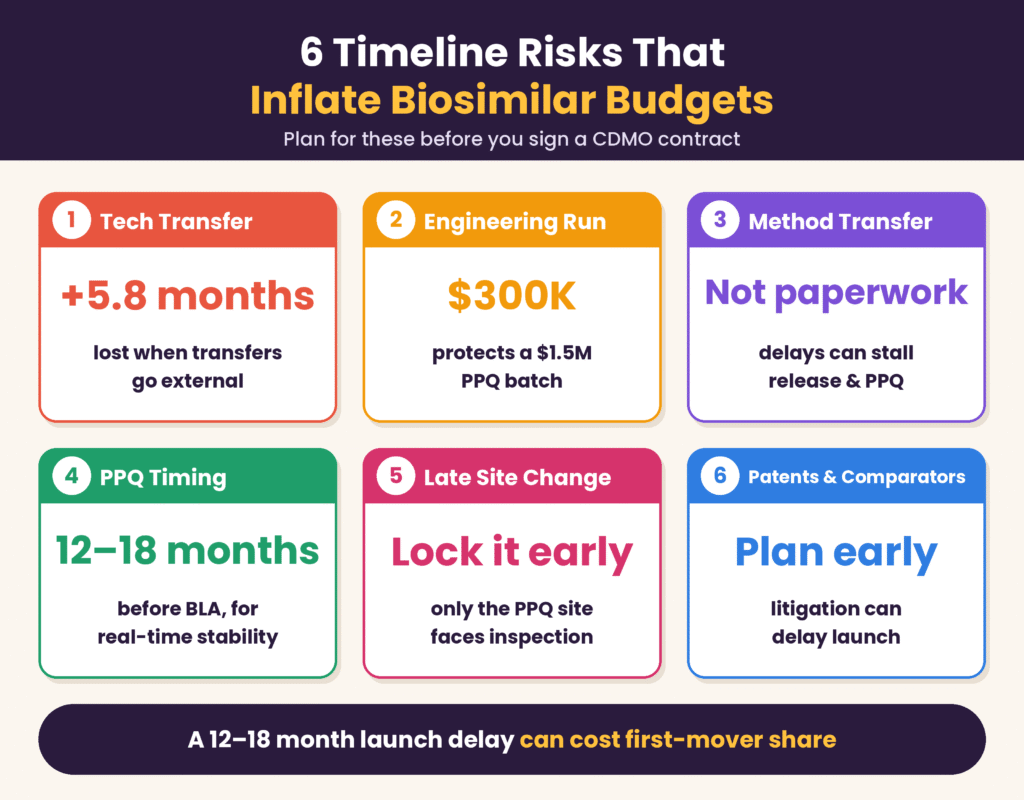
Most Biosimilar Development Cost and Timeline overruns can be traced to five preventable CMC execution problems: external technology transfer difficulties, omitted engineering runs, delayed analytical method transfers, poor alignment of PPQ and stability testing schedules, and late manufacturing site changes without appropriate bridging. These issues can increase development expenditure while also delaying commercial launch and revenue generation.
Since a launch delay of 12 to 18 months can reduce first-mover market share and negatively affect risk-adjusted NPV, sponsors should incorporate specific safeguards into their CDMO budgets and project management plans to address the following six critical bottlenecks:
External Technology Transfer Delays
Research from McKinsey, cited by PharmaSource, indicates that external technology transfers increase average lead times by approximately 5.8 months compared with internal transfers. Neuland Labs also highlights industry estimates suggesting that roughly 50% of technology transfers encounter quality-related problems. Working with an integrated CDMO that maintains development and GMP manufacturing operations at the same site can help reduce these risks by limiting the complexity of external handoffs and improving coordination between development and production teams.
Omitting Engineering Runs
Excluding a non-GMP engineering run to reduce initial development quotations can create significant financial risks. DrugPatentWatch’s CDMO playbook estimates that an engineering run may cost approximately $300,000. Although avoiding this expense may initially appear to reduce development costs, an undetected mixing or scale-up issue could subsequently compromise a PPQ batch valued at $1.5 million. Therefore, engineering runs should be considered an important preventive investment rather than an optional expenditure.
Analytical Method Transfer (AMT) Bottlenecks
Analytical Method Transfer (AMT) should not be treated as a routine administrative or clerical activity. Delays in transferring analytical methods can affect clinical material release and PPQ execution. Acceptance criteria should be statistically established using historical analytical method data in accordance with ICH Q2(R2)/Q14 requirements rather than relying on arbitrary numerical limits. Early planning and appropriate method qualification can help prevent unnecessary delays during critical development milestones.
PPQ and ICH Q5C Stability Misalignment
Accelerated stability studies cannot consistently predict the degradation behavior of complex protein products. For this reason, ICH Q5C requires real-time stability data from commercial-representative PPQ lots. An EirGenix regulatory guide explains that PPQ campaigns should therefore be completed approximately 12 to 18 months before BLA submission. This provides sufficient time to generate meaningful real-time stability data for inclusion in the regulatory filing.
Late Site Changes and Scale-Up Divergence
Only the specific manufacturing site responsible for producing PPQ lots can undergo the relevant Pre-License Inspection (PLI). Consequently, changing the manufacturing site late in development can disrupt regulatory filing readiness and require substantial additional preparation. Furthermore, the historical Myozyme/Lumizyme scale-up precedent, discussed in the ASPE report, illustrates how significant structural differences emerging after scale-up can lead regulators to request a new license application supported by complete clinical assessments.
Review the considerations involved in biosimilar comparability exercises:
Comparability Exercise in Biosimilar Development
BPCIA Patent Dance & Foreign Comparator Bridging
Patent-related litigation under the Biologics Price Competition and Innovation Act (BPCIA), or failure to establish the acceptability of foreign-sourced comparator lots at an early development stage, can delay commercial launch. These challenges may arise even after CMC activities have been completed. Sponsors should therefore evaluate patent-related requirements and foreign comparator bridging strategies alongside analytical and manufacturing planning to minimize regulatory and commercial delays.
CDMO Outsourcing Budget Checklist: How to Compare Proposals Accurately
To compare competing CDMO RFPs on an equivalent Total Cost of Ownership basis, sponsors should evaluate each proposal against seven essential technical and contractual checkpoints before signing a Statement of Work (SOW). Reviewing these areas helps identify differences in manufacturing capabilities, contractual obligations, and potential additional expenses that may not be reflected in the initial quotation.
Verify Named-Site Inspection Records
Review FDA, EMA, Health Canada, and PMDA inspection outcomes for the exact manufacturing facility responsible for producing the drug substance and drug product. Do not rely exclusively on corporate-wide regulatory compliance claims, as inspection status and manufacturing capabilities must be verified for the specific site involved in the program.
Demand Transparent Cost-Per-Gram Drivers
Request documented assumptions covering production titer, downstream recovery yield, resin lifetime, and consumable markups. These factors directly influence the actual cost per gram of manufactured product and should be evaluated alongside the quoted batch price to obtain a more accurate understanding of long-term manufacturing expenses.
Model Layer 2 and Layer 3 Exposure
Evaluate take-or-pay provisions and cancellation penalties under a hypothetical six-month clinical development delay. At the same time, negotiate clearly defined buyout limits for cell line royalties, milestone payments, and foreground process IP to minimize long-term contractual obligations and potential vendor lock-in.
Confirm In-House Analytical & PPQ Readiness
Determine whether product release testing, forced degradation studies, and ICH stability storage are performed internally or through third-party subcontractors. Sponsors should also request and review a redacted PPQ report prepared in the eCTD Module 3.2.S format to assess the CDMO’s documentation capabilities and manufacturing readiness.
Include Engineering Runs and Viral Clearance in Base Pricing
Ensure that engineering batches, estimated at approximately $300,000, and viral clearance studies, costing $200,000–$500,000 per study, are included in the initial development budget. These activities should not be left out of the baseline quotation and subsequently introduced as unexpected mid-program change orders.
Mandate Dual Sourcing and Cell Bank Redundancy
Include contractual requirements for dual-sourced critical resins and single-use kits, a minimum three-month safety stock of essential manufacturing materials, and off-site backup storage for Master and Working Cell Banks. These safeguards can reduce the risk of production interruptions caused by supplier shortages, equipment failures, or unexpected supply-chain disruptions.
Embed Deviation Escalation SLAs
Establish binding timelines for deviation reporting and escalation within the Quality Agreement. For example, any deviation likely to cause a GMP batch delay exceeding five business days should be escalated to the sponsor’s Head of CMC within 24 hours, together with an initial root-cause hypothesis. Clearly defined escalation requirements improve communication, support timely investigations, and help prevent quality-related issues from affecting critical development milestones.
Conclusion
Controlling Biosimilar Development Cost and Timeline when outsourcing to a CDMO in 2026 requires sponsors to approach budgeting as an integrated framework covering CMC execution, analytical comparability, and contractual governance rather than focusing solely on individual manufacturing batch prices. Although FDA Revision 4, the EMA’s tailored clinical reflection paper, and Health Canada’s updated regulatory pathway create opportunities for potential clinical and PK savings of $20 million+ to $44 million and can shorten launch timelines by approximately 1.5 years, realizing these benefits depends on several important operational and financial decisions. Sponsors must allocate sufficient resources to early-stage orthogonal analytical similarity assessments, negotiate flexible manufacturing capacity and IP provisions, and address external technology transfer challenges before they affect the development schedule.
If your team is planning a biosimilar analytical characterization package, formulation development program, or GMP CDMO outsourcing strategy, ResolveMass Laboratories Inc. offers analytical and biosimilar development support through a Health Canada GMP-compliant facility (Drug Establishment Licence holder), an FDA-registered facility (FEI 3042696771), and an ISO 9001:2015 certified laboratory. Its services are supported by 24/7 technical assistance and direct consultations with scientists, helping sponsors address their analytical and development requirements.
Connect with our specialists to discuss your project requirements and identify the appropriate analytical and development support for your program.
Frequently Asked Questions
A conventional biosimilar development program typically takes 6 to 8 years, although complex projects may extend to 7–12 years. This period includes cell line development, process optimization, analytical characterization, clinical studies, and regulatory submissions. Under the tailored FDA and EMA pathways introduced in 2026, eligible programs can shorten development timelines by approximately 1.5 years through the elimination of unnecessary Phase III efficacy trials.
Eliminating a Phase III comparative efficacy study can reduce development expenditure by approximately $20 million to $28 million, depending on the program and study requirements. The FDA estimates savings of around $24 million per waived efficacy study, with additional opportunities to reduce PK testing expenses by up to $20 million. These waivers can also eliminate 1 to 3 years of clinical trial activities.
Under traditional development models, CMC activities account for approximately 38% of the overall biosimilar development budget. This includes around 18% for process development, costing $25–$35 million, and 20% for manufacturing setup and validation, costing $30–$45 million. When Phase III studies are waived, sponsors can redirect additional financial resources toward analytical characterization, process comparability, and manufacturing validation.
Initial CDMO proposals may cover only 60–70% of the actual program expenditure, leaving several additional costs outside the quoted price. These expenses can include capacity reservation deposits, take-or-pay penalties, cell line royalties, analytical method transfers, and ICH stability testing. Engineering runs and viral clearance studies can also increase the budget, costing approximately $300,000 and $200,000–$500,000 per study, respectively.
Take-or-pay provisions require sponsors to pay for manufacturing capacity even when reserved production slots remain unused. For example, a DrugPatentWatch analysis involving 12 reserved slots, of which only 7 were utilized, showed that the effective cost per used batch increased from $2.00 million to $3.43 million. Such contractual conditions can substantially increase manufacturing expenditure when clinical delays or unexpected development changes affect production schedules.
The choice depends on production volume, manufacturing flexibility, and long-term commercial requirements. Single-use bioreactors with capacities of up to 2,000 L offer faster changeovers, lower initial capital requirements, and greater flexibility for clinical and medium-volume production. Stainless steel systems ranging from 2,000–20,000 L are generally more suitable for large-scale commercial manufacturing because they can reduce recurring consumable costs per gram.
External technology transfer can extend manufacturing timelines by approximately 5.8 months compared with internal technology transfer, according to McKinsey research cited by PharmaSource. The process may also introduce technical inconsistencies and quality-related challenges when analytical methods, manufacturing parameters, or process knowledge are not transferred effectively. Selecting an integrated CDMO with development and GMP manufacturing capabilities at the same facility can help minimize these risks.
De novo biosimilar development through a CDMO generally requires an investment exceeding $100 million and takes approximately 6 to 8 years, although regulatory waivers can shorten the timeline. In contrast, in-licensing an approved finished product dossier can reduce regional registration timelines to approximately 1 to 2 years. While licensing lowers upfront development risks and accelerates market entry, it may also limit formulation flexibility and reduce potential commercial margins.
Comprehensive analytical characterization helps demonstrate that a proposed biosimilar closely matches its reference product in terms of structural, physicochemical, and functional properties. Techniques such as HRMS, HDX-MS, NMR, SEC-MALS, and functional potency assays help identify even small differences in Critical Quality Attributes (CQAs). Strong analytical evidence reduces residual uncertainty and supports regulatory decisions regarding the need for additional comparative clinical efficacy studies.
Reference:
- Ranbhor, R., & Kulkarni, P. (2025). Evaluating biosimilar development projects: An analytical framework utilizing net present value. Biologics: Targets & Therapy, 19, 125–135. https://doi.org/10.2147/BTT.S514767
- U.S. Food and Drug Administration. (2026, March 9). FDA takes further steps to streamline biosimilar development and make medicines more affordable. https://www.fda.gov/news-events/press-announcements/fda-takes-further-steps-streamline-biosimilar-development-and-make-medicines-more-affordable
- U.S. Food and Drug Administration. (2026, March 9). FDA takes further steps to streamline biosimilar development and make medicines more affordable. https://www.fda.gov/news-events/press-announcements/fda-takes-further-steps-streamline-biosimilar-development-and-make-medicines-more-affordable
- Ranbhor, R., & Kulkarni, P. (2025). Biosimilar development cost distribution [Figure 2]. In Evaluating biosimilar development projects: An analytical framework utilizing net present value. Biologics: Targets & Therapy, 19, 125–135. https://doi.org/10.2147/BTT.S514767
- European Medicines Agency. (n.d.). Workshop on a tailored clinical approach to biosimilar development. https://www.ema.europa.eu/en/events/workshop-tailored-clinical-approach-biosimilar-development
Get In Touch With Us
About The Author