

Introduction: Why CD Spectroscopy Continues to Be the Gold Standard for Peptide Secondary Structure Characterization
When evaluating the secondary structure of synthetic or recombinant peptides, Circular Dichroism (CD) spectroscopy remains one of the most efficient and informative analytical techniques available. CD spectroscopy for peptide secondary structure characterization offers rapid analysis, physiologically relevant solution-state measurements, and reliable structural insight that very few complementary methods can provide simultaneously. Unlike X-ray crystallography, which requires highly ordered crystal formation, or solution NMR, which is often limited by molecular size and concentration requirements, CD spectroscopy can analyze peptides directly in aqueous buffers at biologically relevant concentrations within minutes rather than days.
At ResolveMass Laboratories Inc., CD spectroscopy represents a core component of peptide structural characterization workflows and is routinely applied in IND-enabling studies, biosimilar comparability assessments, and peptide therapeutic profiling programs. This discussion goes beyond introductory theory and focuses on the practical considerations, quantitative deconvolution methods, and experimental limitations that determine the reliability and interpretive value of CD-based structural analysis.
Learn More about Peptide Analysis Frameworks: Explore our comprehensive guide on Peptide Characterization in Drug Development.
Share via:
Article Summary
- Circular Dichroism (CD) spectroscopy enables differentiation of peptide secondary structures such as α-helices, β-sheets, β-turns, and random coil conformations by analyzing characteristic far-UV spectral patterns, eliminating the need for crystallization or isotopic labeling techniques.
- The far-UV spectral region (190–250 nm) serves as the foundation for peptide secondary structure evaluation, while the near-UV region (250–350 nm) provides additional insight into the tertiary and quaternary environments surrounding aromatic amino acids and disulfide linkages.
- α-helical peptides typically exhibit two distinct negative minima near 208 nm and 222 nm, whereas β-sheet-rich structures generally produce a single negative feature close to 218 nm. In contrast, intrinsically disordered peptides commonly display a pronounced negative band around 200 nm.
- Advanced deconvolution methods, including CDSSTR, CONTIN/LL, SELCON3, and BeStSel, convert experimental CD spectra into estimated secondary structure percentages. The reliability of these calculations depends heavily on selecting an appropriate reference dataset for the peptide system being analyzed.
- Experimental parameters such as peptide concentration, optical path length, buffer composition, solution pH, and cuvette selection significantly influence spectral accuracy and reproducibility, making careful sample preparation essential for obtaining high-quality CD data.
- CD spectroscopy is especially valuable for studying dynamic structural processes in real time, including peptide folding behavior, helix–coil transitions, conformational stability, and aggregation mechanisms under physiologically relevant conditions.
- ResolveMass Laboratories Inc. offers comprehensive CD spectroscopy solutions ranging from sample preparation optimization to validated secondary structure characterization reports for pharmaceutical, biotechnology, and academic research applications.
Far-UV CD Spectral Signatures: Interpreting the Structural Fingerprint
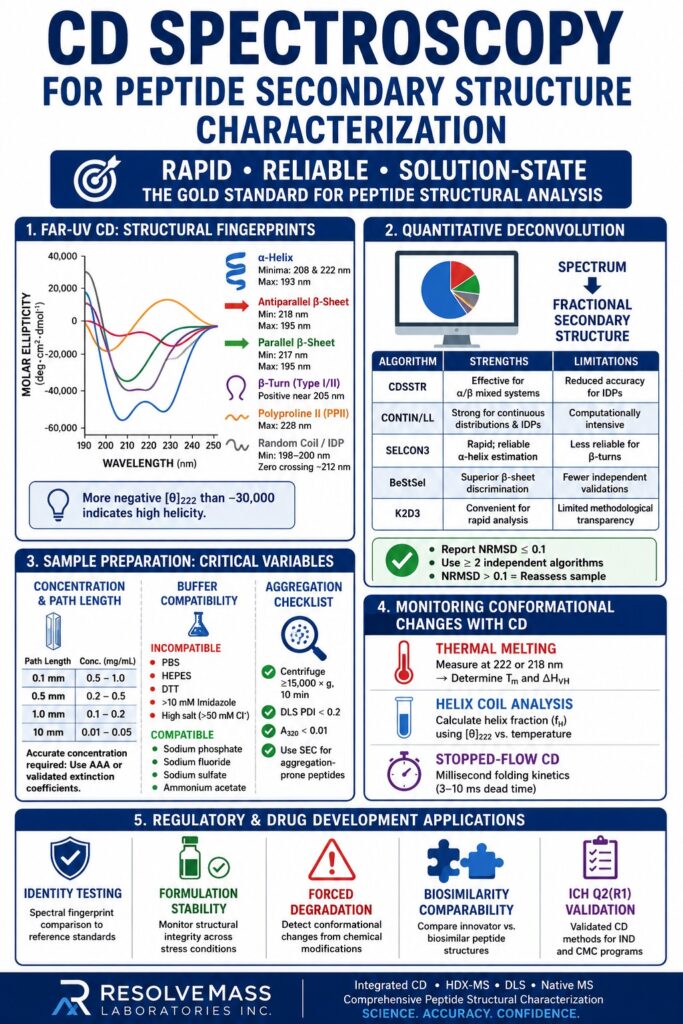
The far-UV spectral region (190–250 nm) directly reflects peptide secondary structure through characteristic electronic transitions associated with peptide bonds. Each dominant conformation produces a reproducible spectral signature that can be used to identify structural populations in solution.
The chromophore responsible for the far-UV CD signal is the peptide bond (amide group). Two major electronic transitions contribute to the observed spectra: the n→π* transition near 220 nm and the π→π* transition near 190 nm. These transitions exhibit differential absorption of left- and right-circularly polarized light, generating characteristic Cotton effects that are highly sensitive to backbone dihedral angles (φ, ψ) within Ramachandran conformational space.
Signature Spectral Profiles by Conformation
| Secondary Structure | Characteristic CD Features | Key Wavelengths |
|---|---|---|
| α-Helix | Two negative minima and one positive maximum | Minima at ~208 nm and ~222 nm; maximum at ~193 nm |
| Antiparallel β-Sheet | One negative minimum and one positive maximum | Minimum at ~218 nm; maximum at ~195 nm |
| Parallel β-Sheet | Similar to antiparallel β-sheet with slight red shift | Minimum near ~217 nm |
| β-Turn (Type I/II) | Weak negative band with positive feature near 205 nm | Approximately 205–215 nm |
| Polyproline II (PPII) | Positive band near 228 nm and negative band near 205 nm | Strong positive feature at 228 nm |
| Random Coil / Intrinsically Disordered | Strong negative band with zero crossing near 212 nm | Minimum around 198–200 nm |
The molar ellipticity [θ] at 222 nm is commonly used as a rapid structural indicator. Values more negative than −30,000 deg·cm²·dmol⁻¹ generally correspond to highly helical peptides, whereas values approaching zero at 222 nm combined with a strong negative signal around 200 nm indicate predominantly disordered conformations.
A critical consideration for short peptides is that peptides containing fewer than 15 residues frequently exhibit reduced helical signal intensity even when their intrinsic helix-forming propensity is significant. This behavior results from terminal fraying and end effects that destabilize helical turns. Consequently, the helicity measured by CD represents a population-weighted average of all conformational states present in solution rather than a single static structure.
Explore Deep Sequencing Capabilities: Read about how secondary structure connects to amino acid ordering in our comparison of Peptide Mapping vs. Peptide Sequencing: Key Differences.
The Near-UV CD Region: Evaluating Aromatic Environment and Peptide Aggregation State
Near-UV CD spectroscopy (250–350 nm) provides information about the tertiary structural environment of aromatic residues such as Phe, Tyr, Trp, and disulfide bonds. This spectral region becomes especially important when confirming folded peptide conformations or identifying aggregation-induced structural alterations.
For peptides containing aromatic amino acids, near-UV CD offers an additional level of structural characterization. The signal arises from restricted aromatic side-chain motion within a chiral environment. Upon unfolding or aggregation, this ordered environment is disrupted, causing the near-UV CD signal to diminish or disappear entirely. Despite its value, this region is often underutilized during analysis of cyclic peptides, stapled peptides, and disulfide-constrained peptides where tertiary interactions play essential functional roles.
Aromatic and Disulfide CD Contributions
- Tryptophan: Broad CD bands between 280–305 nm; generally the most CD-active aromatic residue
- Tyrosine: Fine spectral structure observed near 270–280 nm
- Phenylalanine: Weak but sharp vibronic bands between 255–270 nm, often described as “comb-like”
- Disulfide bonds: Broad and variable signal between 250–270 nm influenced by the Cα–S–S–Cα dihedral angle
In peptide aggregation studies, simultaneous retention of far-UV helical signatures with loss of near-UV CD signal frequently indicates formation of soluble aggregates without complete secondary structure disruption. This phenomenon is particularly relevant in peptide formulation and stability development programs.
Discover Aggregation and Degradation Assays: Review our specialized analytical workflows for Peptide Degradation Product Characterization.
Quantitative Secondary Structure Deconvolution: Algorithms, Reference Sets, and Accuracy Limitations
CD spectral deconvolution converts an experimentally acquired spectrum into estimated fractional secondary structure content. However, the accuracy of this process depends heavily on both algorithm selection and the compatibility of the reference dataset used during analysis.
Experimental CD spectra represent linear combinations of basis spectra corresponding to different secondary structural elements. Several computational algorithms have been developed to solve this inverse problem.
Algorithm Comparison for Peptide Structural Analysis
| Algorithm | Mathematical Approach | Strengths | Limitations |
|---|---|---|---|
| CDSSTR | Ridge regression with variable selection | Effective for α/β mixed systems; robust fitting | Reduced accuracy for highly disordered peptides |
| CONTIN/LL | Regularized least squares (Provencher method) | Strong performance for continuous distributions and IDPs | Computationally intensive |
| SELCON3 | Self-consistent iterative approach | Rapid analysis; reliable α-helix estimation | Less reliable for β-turn quantification |
| BeStSel | β-structure-specific basis spectra | Superior β-sheet discrimination, including parallel vs. antiparallel | Fewer independent validation studies |
| K2D3 | Neural-network-based prediction | Convenient for rapid web-based analysis | Limited methodological transparency |
Selection of an appropriate reference dataset is essential rather than optional. Algorithms trained using folded globular protein datasets such as SP175, SMP180, or PCDDB frequently underestimate disorder and misclassify polyproline II helices in short peptides. For peptides shorter than 30 residues, peptide-focused reference datasets or cross-validated intrinsically disordered protein (IDP) collections, including the PCDDB IDP subset, should be prioritized.
Interpreting Deconvolution Results
- Fractional secondary structure estimates should be reported alongside algorithm-derived NRMSD (normalized root-mean-square deviation) values ≤ 0.1 to verify fit quality
- At least two independent algorithms should be used, with convergence between outputs reported as evidence of structural confidence
- NRMSD values > 0.1 often indicate spectral artifacts, excessive buffer absorption, or peptide aggregation and should prompt reassessment of sample preparation before further interpretation
Read Our Generic Ganirelix Case Study: Learn how structural equivalence is demonstrated via the Peptide Characterization of Ganirelix Generic Project.
Critical Sample Preparation Variables That Determine CD Data Quality
Sample preparation is often the deciding factor between successful and misleading CD measurements. Accurate concentration determination, careful buffer selection, and proper path length optimization are essential experimental requirements.
Concentration and Path Length Optimization
Although CD signal intensity follows the Beer–Lambert relationship, peptide CD measurements present a unique challenge because mean residue ellipticity (MRE) depends directly on accurate peptide concentration determination. Reliable concentration measurements require validated extinction coefficients or quantitative amino acid analysis (AAA), rather than UV absorbance measurements alone, which can be distorted by aromatic side-chain contributions and peptide bond overlap.
| Path Length | Optimal Concentration Range | Recommended Application |
|---|---|---|
| 0.1 mm | 0.5–1.0 mg/mL | Far-UV analysis in high-salt or strongly absorbing buffers |
| 0.5 mm | 0.2–0.5 mg/mL | General far-UV analysis with balanced signal quality |
| 1.0 mm | 0.1–0.2 mg/mL | Near-UV measurements or low-salt conditions |
| 10 mm | 0.01–0.05 mg/mL | Near-UV aromatic analysis only |
Buffer Compatibility: Essential Constraints
Many commonly used biochemical buffers are unsuitable for far-UV CD analysis because they absorb strongly below 210 nm.
Incompatible Buffers and Reagents
- PBS, which absorbs strongly below 200 nm
- HEPES, with a practical cutoff around 220 nm
- DTT, due to strong UV absorption
- Imidazole concentrations above 10 mM
Compatible Buffer Systems
- Sodium phosphate (10–20 mM, pH 7.4)
- Sodium fluoride
- Sodium sulfate
- Ammonium acetate
Sodium chloride concentrations should generally remain at or below 50 mM because chloride ions significantly absorb below 195 nm, limiting the usable spectral range.
The co-solvent 2,2,2-trifluoroethanol (TFE) is commonly used at concentrations between 10–50% v/v to stabilize or induce α-helical structure in otherwise disordered peptides. While highly useful as a conformational probe, spectra obtained in the presence of TFE should be interpreted as solvent-induced conformations rather than physiologically representative states.
Aggregation Assessment Prior to CD Acquisition
Performing CD measurements on aggregated peptide samples can produce misleading spectral artifacts that either mimic or obscure genuine secondary structure.
Before every CD experiment:
- Centrifuge samples at ≥15,000 × g for at least 10 minutes and analyze only the supernatant
- Use dynamic light scattering (DLS) to confirm monodispersity, targeting PDI values < 0.2 for simple peptide systems
- Verify that absorbance at 320 nm remains below 0.01 to minimize scattering artifacts
- Apply size exclusion chromatography (SEC) for peptides known to possess aggregation tendencies
Read Our Generic Lanreotide Case Study: Learn how secondary and higher-order structural testing is applied via the Peptide Characterization of Lanreotide Generic Project.
Monitoring Peptide Folding Kinetics and Conformational Transitions Using CD
CD spectroscopy is particularly valuable for monitoring time-dependent structural changes. Thermal unfolding studies, denaturant titrations, and stopped-flow experiments provide mechanistic insight that static structural techniques cannot easily capture.
Thermal Denaturation and Melting Curves
Temperature-dependent CD measurements at fixed wavelengths, typically 222 nm for α-helices or 218 nm for β-sheet structures, produce sigmoidal melting curves that allow extraction of thermodynamic parameters.
Key Thermodynamic Parameters
- Tm (melting temperature): Midpoint of the unfolding transition and directly comparable across peptide variants
- ΔHvH (van’t Hoff enthalpy): Derived from the slope of the melting transition and indicative of unfolding cooperativity
- Two-state vs. multi-state unfolding: Non-overlapping melting curves at different wavelengths suggest intermediate structural states, an important consideration for therapeutic peptide analysis
Stapled peptides and cyclic peptides frequently display significantly elevated Tm values, often exceeding those of linear analogs by more than 15°C. This observation quantitatively reflects conformational restriction and enhanced thermodynamic stability.
Helix–Coil Transitions and [θ]₂₂₂ Helix Fraction Estimation
The empirical Lifson–Roig and Zimm–Bragg helix–coil models can be estimated using temperature-dependent [θ]₂₂₂ measurements.
fH=[θ]222(obs)−[θ]222(coil)[θ]222(helix,∞)−[θ]222(coil)f_H = \frac{[\theta]_{222}(obs)-[\theta]_{222}(coil)}{[\theta]_{222}(helix,\infty)-[\theta]_{222}(coil)}fH=[θ]222(helix,∞)−[θ]222(coil)[θ]222(obs)−[θ]222(coil)
Where [θ]₂₂₂(helix,∞) is approximately:
[θ]222(helix,∞)≈−44,000+250T[\theta]_{222}(helix,\infty) \approx -44{,}000 + 250T[θ]222(helix,∞)≈−44,000+250T
and [θ]₂₂₂(coil) is approximately +2,000 deg·cm²·dmol⁻¹. Finite chain-length effects can be corrected using the Chen equation to account for peptide end fraying.
Stopped-Flow CD for Rapid Folding Kinetics
Stopped-flow CD instrumentation enables analysis of millisecond-scale folding events, particularly relevant for intrinsically disordered peptides (IDPs) that adopt structure upon target binding. Instrument dead times between 3–10 ms permit observation of early folding intermediates and support mechanistic investigation of peptide–receptor interaction pathways.
Explore Specialized GLP-1 Analysis Platforms: Learn about our end-to-end analytical solutions for complex agonists via our CRO for GLP-1 Peptide Characterization.
CD Spectroscopy in Peptide Drug Development: Regulatory and Characterization Applications
Within pharmaceutical development programs, CD spectroscopy for peptide secondary structure characterization supports ICH Q6B identity and characterization requirements and contributes to biosimilarity assessment for peptide therapeutics.
Regulatory agencies increasingly recognize CD as an important orthogonal biophysical technique for confirming peptide and protein identity. Common applications within development workflows include:
- Batch release identity testing: Spectral fingerprint comparison against reference standards using acceptance criteria based on spectral overlay and [θ]₂₂₂/[θ]₂₀₈ ratio tolerances
- Formulation stability studies: Monitoring structural integrity across varying pH, temperature, and excipient conditions during drug product development
- Forced degradation characterization: Detecting conformational consequences of oxidation (Met, Trp), deamidation (Asn, Gln), or disulfide scrambling through altered CD signatures
- Biosimilarity comparability assessments: Comparing innovator and biosimilar peptide CD spectra under matched concentration and buffer conditions to support analytical similarity conclusions in accordance with FDA biosimilar guidance
Explore Regulatory and Compliance Pathways: Review our specialized services regarding FDA Requirements for Peptide Characterization and how to construct a robust analytical filing package.
ICH-Aligned CD Method Validation Considerations
| Validation Parameter | CD-Specific Considerations |
|---|---|
| Specificity | Demonstrate unique spectral signatures relative to formulation components |
| Precision (Repeatability) | %RSD of [θ]₂₂₂ ≤ 3% across at least three independent preparations |
| Intermediate Precision | Evaluate day-to-day and instrument-to-instrument variability |
| Linearity | Confirm Beer–Lambert linearity across the working concentration range |
| Robustness | Assess the impact of ±5 nm wavelength calibration offset and ±0.05 mg/mL concentration variation |
ResolveMass Laboratories Inc. operates validated CD methods aligned with ICH Q2(R1) principles and supports IND submissions and CMC characterization programs.
Review GLP-1 Chemical Profiling Frameworks: Read more on sequence-specific stability profiles via Peptide Sequencing of GLP-1 Drugs.
Complementary Techniques That Enhance CD Data Interpretation
CD spectroscopy achieves maximum interpretive value when integrated with complementary structural and biophysical techniques. No single analytical method can independently provide complete structural characterization.
| Complementary Method | Information Provided | Integration Benefit |
|---|---|---|
| 2D NMR (NOESY/TOCSY) | Residue-level hydrogen bonding and dihedral constraints | Confirms CD-derived secondary structure assignments at atomic resolution |
| ATR-FTIR | Amide I band analysis (1600–1700 cm⁻¹) | Cross-validates solution-state CD data and solid-state peptide structure |
| DLS / SEC-MALS | Hydrodynamic radius and oligomeric state | Eliminates aggregation as a confounding variable |
| Molecular Dynamics (MD) Simulation | Conformational ensemble populations | Interprets CD averages as ensemble-weighted structural populations |
| HDX-MS | Backbone protection factors and conformational dynamics | Adds kinetic and dynamic insight to CD structural snapshots |
| ESI-MS / Native MS | Intact mass and disulfide connectivity | Confirms chemical identity before structural interpretation |
At ResolveMass Laboratories Inc., integrated characterization platforms combining CD, HDX-MS, DLS, and native ESI-MS provide multidimensional peptide structural analysis suitable for both academic research and pharmaceutical regulatory requirements.
Discover ANDA Fingerprinting Services: Explore how we establish complete biochemical fingerprints for regulatory filings through a formal Peptide Sameness Study for ANDA.
Common Artifacts and Troubleshooting in Peptide CD Spectroscopy
Most peptide CD artifacts originate from buffer absorption, aggregation, concentration inaccuracies, or photomultiplier saturation. Each issue produces characteristic spectral behavior and requires specific corrective action.
| Artifact | Spectral Appearance | Likely Cause | Corrective Action |
|---|---|---|---|
| High voltage (HV) alarm/noise below 200 nm | Excessive noise below 200 nm | Buffer absorption or excessive path length | Reduce path length and switch to CD-compatible buffer |
| Unexpected positive signal at 240–260 nm | Abnormal positive band | Aromatic or nucleic acid contamination | Verify purity using A260/A280 ratio and purify sample |
| Non-reproducible spectra between runs | Signal drift | Temperature fluctuations or peptide adsorption | Use temperature-controlled holder and silanized cuvette |
| Flat spectrum at expected concentration | Minimal or absent signal | Aggregated or precipitated peptide | Centrifuge and reassess solubility |
| Artificially large [θ] values | Overestimated helicity | Concentration underestimation | Use AAA or quantitative NMR for accurate concentration |
| Non-flat baseline at 260–280 nm | Sloping baseline | Light scattering from particles | Filter through 0.22 µm membrane and confirm using DLS |
Conclusion: Applying Rigorous CD Spectroscopy for Peptide Secondary Structure Characterization
CD spectroscopy for peptide secondary structure characterization, when performed with rigorous experimental control, appropriate buffer selection, validated concentration measurements, algorithm-appropriate deconvolution, and orthogonal data integration, provides rapid and quantitatively reliable structural insight.
CD spectroscopy should not be treated as a simplistic identity assay. Every aspect of the experiment, including buffer composition, concentration accuracy, and deconvolution strategy, directly influences mechanistic interpretation. Scientists who apply CD only as a routine screening tool often overlook its broader value as a quantitative conformational technique capable of monitoring folding kinetics, conformational transitions, aggregation pathways, and drug-induced structural perturbations within a single analytical platform.
At ResolveMass Laboratories Inc., our scientific team combines extensive expertise in CD method development, structural deconvolution, and regulatory-grade peptide characterization. Whether the target molecule is a short linear therapeutic peptide, a stapled α-helix, a cyclic scaffold, or an intrinsically disordered peptide region, our integrated biophysical characterization platform is designed to generate the structural data required for confident decision-making and regulatory compliance.
Get Started with Regional Support: Partner with our regional laboratories to initiate your program by reviewing our local platforms at Peptide Sameness Study Services in Canada
or Peptide Sameness Study Services in United States.
Ready to characterize your peptide’s secondary structure with confidence? Contact ResolveMass Laboratories Inc..
Frequently Asked Questions (FAQs)
For accurate peptide secondary structure characterization, the far-UV region between 190–250 nm should be analyzed because this range contains the peptide bond transitions responsible for α-helix, β-sheet, and random coil signatures. Limiting spectral acquisition above 200 nm can significantly reduce deconvolution accuracy, especially for intrinsically disordered or β-sheet-rich peptides whose key features appear near 198–205 nm. Buffer composition is also important, since highly absorbing buffers can restrict access to lower wavelengths. In many cases, sodium fluoride or sodium sulfate buffers are preferred over chloride-containing salts to maintain usable spectral range in the far-UV region.
Peptides containing as few as 8–10 amino acids can generate measurable CD spectra, although structural interpretation becomes increasingly challenging for peptides shorter than approximately 15 residues. Short peptides are highly dynamic in solution and often exist as rapidly changing conformational ensembles rather than stable secondary structures. Because of this flexibility, the observed CD spectrum reflects an average of multiple conformations present at equilibrium. Researchers frequently use helix-promoting solvents such as TFE or HFIP, along with low-temperature conditions, to evaluate the intrinsic folding tendency of short peptide sequences while acknowledging that these conditions may not represent physiological environments.
CD spectroscopy can distinguish parallel from antiparallel β-sheet conformations, although interpretation requires careful analysis and high-quality spectral data. Antiparallel β-sheets generally display a stronger negative minimum near 217–218 nm along with a positive band around 195–198 nm, whereas parallel β-sheets often show slightly shifted minima and altered band intensities. Advanced deconvolution tools such as the BeStSel algorithm improve discrimination between these β-sheet arrangements by incorporating strand twist and orientation parameters. However, β-sheet-rich peptides frequently self-associate or aggregate, making complementary techniques such as DLS or TEM valuable for confirming the structural assignment.
The ideal peptide concentration depends on both the optical path length and the spectral region being analyzed, but most far-UV CD experiments are performed within a concentration range of approximately 0.1–0.5 mg/mL. The objective is to maintain absorbance values within the instrument’s linear operating range while preserving acceptable signal-to-noise quality. Excessively concentrated samples can produce detector saturation or light-scattering artifacts, whereas very dilute samples may generate weak and unreliable spectra. Accurate concentration determination is essential, and quantitative amino acid analysis is generally more reliable than UV absorbance alone, particularly for peptides lacking aromatic residues.
Mean residue ellipticity (MRE) is calculated by normalizing the observed ellipticity signal according to peptide concentration, path length, and molecular composition. This normalization allows direct comparison between peptides of different sizes and sequences. Raw CD values recorded in millidegrees are not sufficient for meaningful cross-study interpretation because they do not account for residue number or molecular weight differences. Reporting data as MRE is considered standard practice in peptide structural analysis, particularly when comparing helicity, disorder, or folding behavior across multiple peptide variants.
Circular Dichroism (CD) and Optical Rotatory Dispersion (ORD) are both chiroptical techniques that measure optical activity, but they evaluate different physical properties. CD measures the differential absorption of left- and right-circularly polarized light, while ORD measures wavelength-dependent optical rotation caused by differences in refractive index. Although the two techniques are mathematically related, CD spectroscopy provides more distinct and structurally interpretable spectral features for proteins and peptides. Because of its clearer structural resolution and easier interpretation, CD has largely replaced ORD in modern peptide secondary structure analysis.
pH can strongly affect peptide CD spectra because changes in protonation state alter both intramolecular interactions and peptide solubility. Ionizable residues such as histidine, glutamate, aspartate, and lysine may shift the conformational equilibrium as pH changes, leading to measurable differences in secondary structure. In amphipathic peptides, approaching the isoelectric point often promotes self-association or β-sheet formation due to reduced electrostatic repulsion. Performing systematic pH titration experiments by CD is therefore highly useful for studying pH-responsive peptides, membrane-active sequences, and therapeutic systems designed for endosomal or acidic environments.
For the majority of peptide secondary structure studies, a properly calibrated bench-top CD spectrometer is sufficient to generate high-quality data. Standard laboratory instruments can routinely collect spectra down to approximately 190 nm when compatible low-absorbance buffers are used. Synchrotron radiation CD (SRCD) extends the accessible wavelength range further into the vacuum-UV region and can improve structural discrimination for highly disordered or conformationally complex peptide systems. However, SRCD is generally reserved for specialized research applications rather than routine pharmaceutical or analytical characterization workflows.
CD spectroscopy is considered highly reproducible when instruments are properly calibrated and standardized operating procedures are followed. Most variability between laboratories arises from differences in wavelength calibration, detector performance, sample preparation, and spectral processing rather than from limitations of the technique itself. Under controlled conditions, inter-laboratory agreement for parameters such as [θ]₂₂₂ is typically within a few percent for identical samples. To improve reproducibility and transparency, many researchers report results from multiple deconvolution algorithms and deposit raw spectra in publicly accessible databases such as the Protein Circular Dichroism Data Bank (PCDDB).
Reference:
- U.S. Food and Drug Administration (2019). Considerations in Demonstrating Interchangeability With a Reference Product: Guidance for Industry. FDA. https://www.fda.gov/media/124907/download
- ICH Harmonised Tripartite Guideline (1999). Specifications: Test Procedures and Acceptance Criteria for Biotechnological/Biological Products Q6B. ICH. https://www.ich.org/page/quality-guidelines
- National Center for Biotechnology Information. (n.d.). PubMed Central (PMC). U.S. National Library of Medicine. https://pmc.ncbi.nlm.nih.gov/articles/PMC4928357/
- European Medicines Agency. (2023). Draft guideline on the development and manufacture of synthetic peptides (EMA/CHMP/CVMP/QWP/387541/2023). https://www.ema.europa.eu/en/documents/scientific-guideline/draft-guideline-development-manufacture-synthetic-peptides_en.pdf
- Boutin, J. A., Tartar, A. L., van Dorsselaer, A., & Vaudry, H. (2019). General lack of structural characterization of chemically synthesized long peptides. Protein Science, 28(5), 857–867. https://doi.org/10.1002/pro.3601
Get In Touch With Us
About The Author