Introduction to Comparative Testing Between Generic and RLD
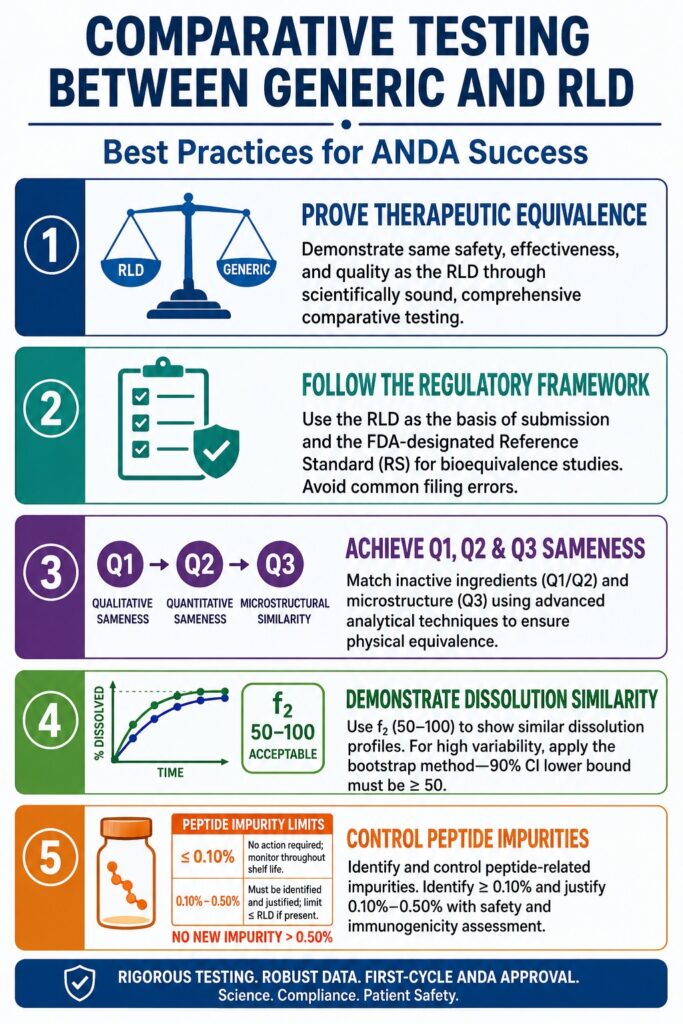
Comparative Testing Between Generic and RLD serves as a fundamental regulatory and scientific process designed to demonstrate that a proposed generic drug product delivers the same therapeutic effectiveness, safety profile, and quality standards as its branded counterpart. This analytical evaluation forms the backbone of an Abbreviated New Drug Application (ANDA) by establishing both pharmaceutical equivalence and bioequivalence in accordance with the Federal Food, Drug, and Cosmetic Act. By confirming that a generic product is therapeutically equivalent to the Reference Listed Drug (RLD), manufacturers can rely on the FDA’s previous determinations regarding safety and efficacy, thereby avoiding the extensive costs and lengthy timelines associated with clinical trials required for new chemical entities.
Conducting this comparative testing extends far beyond a simple regulatory requirement. It represents a sophisticated scientific undertaking that demands expertise in physical chemistry, material science, analytical characterization, and advanced statistical methodologies. Under the Generic Drug User Fee Amendments (GDUFA III), regulatory expectations have become increasingly rigorous. Although the FDA has committed to reviewing standard original ANDAs within defined timelines, these review goals are achieved only when applicants submit scientifically sound, comprehensive, and deficiency-free data packages. To remain competitive in this environment, generic drug manufacturers must establish a high level of analytical certainty through comprehensive deformulation studies, detailed structural characterization, and extensive impurity profiling.
To discover how tailored contract testing services can help satisfy these rigorous regulatory requirements, visit Analytical Services for Generic Drug Development.
Article Summary
- Comparative Testing Between Generic and RLD is a critical component of ANDA submissions, helping demonstrate that a generic drug matches the reference product in quality, safety, efficacy, and therapeutic performance.
- Successful generic drug development requires a clear understanding of FDA regulatory requirements, including the distinct roles of the Reference Listed Drug (RLD) and the Reference Standard (RS) in formulation comparisons and bioequivalence studies.
- Q1/Q2 deformulation studies focus on matching the inactive ingredients and their concentrations to the reference product, reducing regulatory risk and supporting product equivalence.
- Q3 characterization evaluates the microstructure and physicochemical properties of a formulation, ensuring that manufacturing differences do not affect drug release, stability, or bioavailability.
- Dissolution profile comparison using the similarity factor (f₂) remains a key regulatory tool for assessing in vitro performance, while bootstrap statistical methods can be applied when dissolution data exhibit high variability.
- For complex products such as synthetic peptides, extensive structural characterization and comparative impurity profiling are necessary to establish active ingredient sameness and address potential safety or immunogenicity concerns.
- Many ANDA review delays stem from preventable quality issues, including inadequate method validation, insufficient impurity qualification, incomplete extractables and leachables assessments, and unresolved polymorphism, highlighting the importance of a comprehensive analytical and regulatory strategy.
Understanding the Regulatory Foundations of Comparative Testing Between Generic and RLD
The regulatory basis for Comparative Testing Between Generic and RLD depends on accurately identifying the appropriate reference products listed in the FDA’s Orange Book and selecting the correct basis of submission. A clear understanding of the separate functions of the RLD and the Reference Standard (RS) is essential for avoiding filing errors and preventing unnecessary regulatory delays.
An RLD is the approved drug product upon which an ANDA applicant relies when seeking approval for a generic version. The applicant must demonstrate that the proposed generic drug is the same as the RLD with respect to active ingredient(s), dosage form, route of administration, strength, labeling, and approved conditions of use. In contrast, the RS is the specific listed drug designated by the FDA for conducting required in vivo bioequivalence studies. In most cases, the FDA identifies the RLD as the reference standard; however, exceptions may occur, particularly when the original branded product is no longer marketed.
                                   │
         ┌─────────────────────────┴─────────────────────────┐
         ▼                                                   ▼

  • Qualitative Sameness (Q1)                    • Physical BE Testing
  • Quantitative Sameness (Q2)                   • In Vivo PK/PD Studies
  • Microstructural Similarity (Q3)              • In Vitro BE (if justified)
  • Product Labeling & IFU
This distinction between the RLD and RS creates a dual-comparison framework that applicants must manage carefully. When the FDA-designated RS differs from the RLD, physical bioequivalence studies must be conducted using the RS, while formulation comparisons and labeling evaluations must be performed against the RLD. One of the most common regulatory mistakes is identifying the RS as the basis of submission in the ANDA. The basis of submission must always be the RLD.
If the RLD has been discontinued and appears in the Discontinued Drug Product List section of the Orange Book, the applicant is required to submit a Citizen Petition under 21 CFR 10.25(a) and 10.30. This petition seeks FDA confirmation that the product was not withdrawn from the market for reasons related to safety or effectiveness before generic development proceeds.
For strategic assistance navigating these complex global documentation pipelines, see Regulatory Support for Generic Drug Development.
Best Practices in Q1 and Q2 Deformulation
Q1 and Q2 deformulation involves determining the qualitative (Q1) and quantitative (Q2) composition of inactive ingredients within a proposed generic drug product relative to the reference listed drug. This analytical process verifies that the generic formulation contains the same inactive ingredients (Q1) and that their concentrations remain within ±5% of the reference formulation levels (Q2).
Achieving Q1/Q2 sameness typically requires a comprehensive reverse-engineering strategy utilizing orthogonal chromatographic and spectroscopic methods. This process involves separating the active pharmaceutical ingredient (API) from the excipient matrix and accurately quantifying each individual component. Inactive ingredients must be identified not only by chemical identity but also by grade specification and compendial standard.
For dosage forms where regulations do not explicitly require Q1/Q2 sameness, such as oral solid dosage forms, pursuing Q1/Q2 alignment remains highly beneficial. Such alignment may support eligibility for biowaivers under the Biopharmaceutics Classification System (BCS) and reduce overall regulatory risk.
A particularly important component of Q1/Q2 compliance is the management of functional excipients. Minor quantitative differences may occasionally be acceptable for non-functional fillers; however, functional excipients, including penetration enhancers, release-modifying polymers, and solubilizing surfactants, must closely match the reference product to avoid altering drug performance characteristics. Additionally, the concentration of any inactive ingredient must remain within the limits specified in the FDA’s Inactive Ingredient Database (IID) for the intended route of administration. Proposing excipient levels that exceed established IID limits without comprehensive toxicological justification frequently results in significant regulatory deficiencies.
Best Practices in Q3 Physicochemical and Structural Characterization
Q3 characterization examines the microstructural arrangement, physical attributes, and chemical behavior of a generic formulation relative to the reference standard in order to establish physical equivalence. Demonstrating microstructural equivalence is critical because differences in manufacturing processes may affect both in vitro drug release (IVRT) and in vivo bioavailability.
Even when a generic product achieves qualitative (Q1) and quantitative (Q2) sameness with the RLD, variations in manufacturing conditions such as shear forces, heating cycles, cooling rates, or processing parameters can produce differences in the arrangement of matter within the formulation. These variations, commonly referred to as Q3 differences, may significantly influence critical quality attributes (CQAs).
For example, in topical creams and emulsion-based formulations, microstructural differences can alter droplet size distribution, phase volume ratios, and rheological characteristics. These properties directly affect drug partitioning, release behavior, and skin penetration performance.
To generate a robust Q3 data package, developers should employ multiple complementary analytical techniques. Testing should be conducted on several batches of the proposed generic product as well as multiple lots of the reference product to account for manufacturing variability.
For expert support transitioning your microstructural data package from small-scale testing to commercial production, explore Manufacturing Scale-Up for Generic Drugs.
Primary Parameters and Analytical Approaches for Demonstrating Microstructural Equivalence
| Characterization Domain | Key Parameters Evaluated | Regulatory and Biopharmaceutic Relevance | Principal Testing Techniques |
|---|---|---|---|
| Q3 Physical Properties | Rheological profiling (viscosity, shear rate, yield stress, thixotropy, viscoelasticity) | Influences spreadability, thermodynamic activity, and drug release behavior | Rotational rheometers, oscillatory rheometry, texture analyzers |
| Q3 Physical Properties | Particle, droplet, and globule size distribution (PSD/GSD) | Assesses emulsion consistency, surface area, and physical stability | Laser diffraction, dynamic light scattering (DLS), optical microscopy |
| Q3 Structural Attributes | Crystallinity, polymorphic forms, and solid-state phases | Affects solubility, dissolution, stability, and precipitation potential | X-Ray Powder Diffraction (XRPD), Differential Scanning Calorimetry (DSC), Thermogravimetric Analysis (TGA) |
| Q3 Structural Attributes | Molecular interactions and spatial component mapping | Confirms chemical compatibility and phase distribution | Fourier Transform Infrared (FTIR) spectroscopy, Raman spectroscopy, Confocal Raman Mapping |
| Q3 Chemical Properties | pH, buffer capacity, oxidative stability, peroxide values | Supports chemical stability, API ionization control, and local tolerability | High-performance liquid chromatography (HPLC), GC-MS, pH measurement, peroxide testing |
Statistical Best Practices for In Vitro Dissolution Profile Comparison
In vitro dissolution profile comparison is an essential regulatory tool used to verify that the rate and extent of drug release from a generic formulation are comparable to those of the reference listed drug under physiologically relevant conditions. This comparison is most commonly performed using the model-independent similarity factor (f₂), which quantitatively measures the similarity between dissolution profiles.
The similarity factor (f₂) is calculated using a logarithmic reciprocal square-root transformation applied to the sum of squared differences between the dissolution profiles of the test and reference products.
When dissolution profiles are identical, the f₂ value equals 100. When the average difference between the two profiles is exactly 10% across all measured time points, the resulting f₂ value is 50. Regulatory authorities worldwide generally accept an f₂ range of 50 to 100 as evidence that two dissolution profiles are similar.
To maintain the statistical integrity of the f₂ calculation, FDA and international regulatory guidelines impose several requirements:
Sample Size: A minimum of 12 dosage units must be evaluated for both test and reference products.
Sampling Time Points: Dissolution testing must be performed at identical, predetermined sampling intervals for both formulations.
Number of Time Points: At least three non-zero dissolution time points must be included.
Asymptote Limitation: Only one measurement point may be included after both products have achieved more than 85% dissolution. This restriction prevents distortion caused by plateau-phase data.
Data Variability Requirements: The coefficient of variation (%CV) or relative standard deviation (RSD) must remain below 20% at the first non-zero time point and below 10% at all subsequent sampling points.
Applying the Bootstrap Method for Highly Variable Dissolution Testing
The bootstrap method represents an advanced, model-independent statistical approach used when high variability prevents reliable use of a conventional f₂ point estimate. Significant batch-to-batch or unit-to-unit variability may cause standard deviations to exceed the established 20% and 10% variability thresholds, making traditional f₂ calculations statistically inappropriate.
The bootstrap approach addresses this issue by evaluating dissolution similarity through confidence interval analysis rather than relying on a single point estimate.
(12 Test / 12 Reference Units)
             │
             ▼
 ──► (Generate N = 5,000 to 10,000 Bootstrap Samples)
             │
             ▼
 ──► (Generate a Distribution of Bootstrap f2 Values)
             │
             ▼
 ──► (Correct for Skewness Using Jackknife Acceleration)
             │
             ▼
[ 90% Confidence Interval (CI) ]
             │
             ▼
[ Acceptance Criterion ]
             │
             ▼
(Lower Bound of 90% CI ≥ 50)
Through calculation of the bias-corrected and accelerated (BCa) 90% confidence interval, the bootstrap method provides strong statistical evidence of product similarity. When the lower limit of the BCa 90% confidence interval is equal to or greater than 50, the dissolution profiles are considered similar under regulatory standards.
If bootstrap analysis does not demonstrate similarity, developers may adopt model-dependent approaches. These methods include fitting dissolution data to mathematical models such as Weibull or Logistic functions and evaluating a 90% confidence region around the Multivariate Statistical Distance (MSD).
Best Practices for Peptides and Complex Mixtures: Sameness and Comparative Impurity Profiling
Comparative impurity profiling for synthetic peptides and complex mixtures focuses on demonstrating that the generic active ingredient exhibits chemical identity and safety characteristics equivalent to those of the reference listed drug. Synthetic peptides, including products such as liraglutide and salmon calcitonin, present unique regulatory challenges because their structural complexity and impurity profiles may influence clinical safety and immunogenicity.
To establish active ingredient sameness for a generic synthetic peptide, the FDA recommends comparative characterization using orthogonal analytical techniques across four major levels of macromolecular structure:
Primary Sequence: Verification of the amino acid sequence and physicochemical characteristics of the peptide backbone.
Secondary Structure: Confirmation of alpha-helix, beta-sheet, and random-coil conformations using Circular Dichroism (CD) and FTIR spectroscopy.
Oligomeric and Aggregation States: Evaluation of self-association and aggregate formation through Size-Exclusion Chromatography (SEC-MALS) or Analytical Ultracentrifugation (AUC).
Biological Activity: Confirmation of receptor-binding characteristics and functional potency through comparative in vitro bioassays.
For detailed insights into testing pathways for complex molecules, learn more about Generic Peptide and Oligonucleotide Projects.
                [ Peptide Impurity Classification & Limits ]
                                     │
           ┌─────────────────────────┴─────────────────────────┐
           ▼                                                   ▼

   [ Impurity ≤ 0.10% ]                         [ Impurity 0.10% - 0.50% ]

   • No action required                         • Must be identified
   • Monitor throughout shelf life              • If present in RLD: limit ≤ RLD
                                                 • If new/elevated: justify safety
                                                   and immunogenicity risk
Regulatory expectations for peptide-related impurities are particularly stringent. Current FDA guidance requires identification and characterization of any peptide-related impurity present at levels greater than or equal to 0.10%.
If the impurity exists in both the generic and RLD products, the generic formulation must demonstrate impurity levels that are equal to or lower than those observed in the RLD. For newly identified peptide-related impurities present between 0.10% and 0.50%, applicants must provide a scientific justification supported by immunogenicity risk assessments, including evaluations of innate immune activation and adaptive immune responses.
No newly identified peptide-related impurity should exceed 0.50%. Comparative impurity studies should be conducted using multiple batches of both the generic and reference products. Generic samples should be evaluated both at product release and near the end of the proposed shelf-life period using orthogonal chromatographic techniques coupled with High-Resolution Mass Spectrometry (UHPLC-HRMS/MS).
For specialized analytical pathways targeting high-demand peptide assets, review the Generic Peptide Semaglutide Projects
platform, or see the custom programs for Liraglutide Generic Development Services
and Lanreotide Generic Development Services.
Mitigating Common Regulatory Deficiencies in ANDA Submissions
Reducing regulatory deficiencies in ANDA submissions requires proactive analytical method validation, comprehensive stability assessment, and thorough justification of formulation differences relative to the reference listed drug. Between FY2018 and FY2023, approximately 40% of submitted ANDAs achieved approval by the second review cycle, while roughly 60% required additional review cycles due to unresolved deficiencies.
FDA review analyses have shown that quality-related issues account for more than 70% of first-cycle major deficiencies.
The most common scientific causes include:
Unqualified Impurities
Proposing impurity acceptance limits that exceed qualification thresholds established by ICH Q3A/B without providing sufficient toxicological studies or (Q)SAR mutagenicity assessments.
Inadequate Method Validation
Failure to validate stability-indicating analytical methods under forced degradation conditions including acid, base, oxidation, photolytic exposure, and thermal stress to demonstrate assay specificity.
To secure structured stress-testing frameworks that resolve assay specificity concerns, visit Forced Degradation of Biosimilars.
Incomplete Extractables and Leachables (E/L) Assessments
Insufficient E/L method validation or failure to perform toxicological qualification of migrant species originating from container closure systems used in complex parenteral or ophthalmic products.
Unresolved Polymorphism
Lack of robust characterization using techniques such as XRPD and thermal analysis to adequately control crystalline form, potentially impacting stability and dissolution performance.
Drug-Device Combination Product Design Mismatches
For generic combination products such as auto-injectors and metered-dose inhalers, failure to perform detailed user interface threshold analyses relative to the RLD. Where design differences affect user interaction, applicants must conduct comparative task analyses and human factors studies demonstrating that the generic product can be substituted without additional training or healthcare provider intervention.
Conclusion: Ensuring Compliance through Rigorous Comparative Testing Between Generic and RLD
In summary, conducting comprehensive Comparative Testing Between Generic and RLD remains one of the most important factors influencing first-cycle ANDA approval and successful demonstration of therapeutic equivalence. Through advanced deformulation strategies, robust statistical methodologies, and comprehensive impurity qualification programs, generic drug developers establish the scientific credibility and regulatory confidence expected by global health authorities.
Rather than treating comparative testing as a collection of independent analytical activities, successful developers approach it as a fully integrated, multidisciplinary characterization program that connects chemistry, material properties, manufacturing science, and clinical performance.
Achieving this level of scientific rigor often requires collaboration with a contract laboratory operating at the highest levels of technical expertise and regulatory compliance. Advanced analytical capabilities, including solid-state characterization, high-resolution mass spectrometry, and sophisticated statistical modeling, are essential for evaluating complex generic formulations and synthetic peptide products.
For advanced mass spectrometry options to definitively prove product equivalence, see how to Prove Biosimilarity Using LC-MS.
Working with a specialized analytical team helps ensure that method validation, stability profiling, structural characterization, and impurity assessments meet international regulatory expectations. To discuss a regulatory testing strategy or initiate a comparative study, contact the specialists at ResolveMass Laboratories Inc. through their contact page: https://resolvemass.ca/contact/
Frequently Asked Questions (FAQs)
A Reference Listed Drug (RLD) is the FDA-designated product that serves as the benchmark for demonstrating formulation sameness, labeling consistency, and overall therapeutic equivalence in an ANDA submission. A Reference Standard (RS), however, is the specific product selected by the FDA for conducting bioequivalence studies. Although the RLD and RS are often the same product, the FDA may designate a different approved drug as the RS when the original branded product is no longer marketed. Understanding this distinction is essential for avoiding regulatory submission errors.
An f₂ similarity assessment is generally unnecessary when both the generic and reference products exhibit very rapid dissolution characteristics. Specifically, if at least 85% of the labeled drug content dissolves within 15 minutes in all three recommended dissolution media, a mathematical profile comparison may not be needed. These media typically include 0.1 N hydrochloric acid, pH 4.5 acetate buffer, and pH 6.8 phosphate buffer. Under such conditions, the products are considered to have comparable dissolution behavior without further statistical evaluation.
Demonstrating Q3 microstructural similarity requires a detailed comparison of the physical and structural characteristics of the generic and reference formulations. Scientists commonly use rheometry to evaluate viscosity and flow behavior, while laser diffraction helps determine particle or droplet size distribution. Techniques such as Differential Scanning Calorimetry (DSC) and X-Ray Powder Diffraction (XRPD) are applied to assess thermal and crystalline properties. Additionally, FTIR and Raman spectroscopy are frequently used to investigate molecular interactions and component distribution within the formulation matrix.
Excessive variability in dissolution results can compromise the reliability of a standard f₂ similarity calculation. When variability exceeds accepted regulatory limits, the calculated f₂ value may no longer provide a valid measure of profile similarity. In these situations, a bootstrap statistical approach is often employed. This method repeatedly resamples the dissolution data thousands of times to generate a confidence interval, allowing similarity to be demonstrated through a more robust and scientifically defensible statistical assessment.
For injectable drug products, regulatory expectations regarding inactive ingredient composition are particularly strict. The FDA generally requires both qualitative (Q1) and quantitative (Q2) sameness between the proposed generic product and the reference listed drug. In practice, this means the inactive ingredients should match those of the reference product, with concentrations typically maintained within ±5% of the RLD values. Adhering to these requirements helps ensure comparable safety, stability, and performance characteristics.
Establishing active ingredient sameness for a synthetic peptide involves a comprehensive analytical comparison using multiple complementary techniques. The evaluation typically begins with confirmation of the amino acid sequence and extends to characterization of secondary structural features such as alpha-helices and beta-sheets. Additional studies assess aggregation behavior, oligomer formation, and higher-order structural attributes. Comparative biological activity testing is also performed to confirm that the generic peptide functions similarly to the reference product.
Current regulatory guidance requires careful monitoring and characterization of peptide-related impurities because of their potential impact on safety and immunogenicity. Any impurity detected at or above 0.10% generally must be identified and scientifically evaluated. Manufacturers are expected to establish stringent impurity specifications and justify any proposed limits using analytical and toxicological data. Maintaining impurity levels within acceptable thresholds is a critical component of demonstrating product quality and regulatory compliance.
A Refuse-to-Receive (RTR) letter is typically issued when the FDA determines that an ANDA submission is incomplete or lacks essential supporting information. Common causes include insufficient stability data, inadequate impurity qualification, missing validation reports, or incomplete analytical documentation. Failure to provide scientifically justified specifications or required regulatory information can also trigger an RTR determination. Ensuring that all submission components are complete and compliant before filing can significantly reduce this risk.
Reference:
- U.S. Food and Drug Administration. (2017, January). Comparative analyses and related comparative use human factors studies for a drug-device combination product submitted in an ANDA: Draft guidance for industry. U.S. Department of Health and Human Services. https://www.fda.gov/files/drugs/published/Comparative-Analyses-and-Related-Comparative-Use-Human-Factors-Studies-for-a-Drug-Device-Combination-Product-Submitted-in-an-ANDA–Draft-Guidance-for-Industry.pdf
- Fine, A. J. (2022, April 27). Best practices for conducting comparative analyses in ANDAs [Conference presentation]. SBIA Generic Drug Forum, U.S. Food and Drug Administration. https://www.fda.gov/media/165552/download
- Soukup, S. (2022, September 20). Approach to a comparative analysis when the RLD is unavailable [Conference presentation]. SBIA 2022: Advancing Generic Drug Development: Translating Science to Approval. U.S. Food and Drug Administration. https://www.fda.gov/media/166578/download
- Stevens, R. E., Gray, V., Dorantes, A., Gold, L., & Pham, L. (2015). Scientific and regulatory standards for assessing product performance using the similarity factor, f2. The AAPS Journal, 17(2), 301–306. https://doi.org/10.1208/s12248-015-9723-y