


Introduction
Designing a Comparative PK Similarity Study for Biosimilars requires the strategic integration of sensitive population selection, rigorous bioequivalence metrics, and robust statistical sample size estimation to demonstrate that no clinically meaningful differences in drug exposure exist between a proposed biosimilar candidate and its reference product. As global regulatory authorities, including the U.S. Food and Drug Administration (FDA) and the European Medicines Agency (EMA), move away from routinely requiring Phase III comparative efficacy studies, the pivotal comparative pharmacokinetic (PK) study serves as a primary clinical foundation for establishing biosimilarity. Unlike traditional small-molecule bioequivalence studies, the characterization of biotherapeutics must account for structural heterogeneity, target-mediated drug disposition (TMDD), long elimination half-lives, and anti-drug antibody (ADA) immunogenicity. Consequently, study protocols must be carefully designed to distinguish genuine product-related differences from biological noise and inter-subject variability.
A comprehensive understanding of structural attributes is essential before initiating comparative clinical assessments. Explore how biosimilar characterization services can support the analytical evidence needed to establish product similarity.
Share via:
Quick Summary
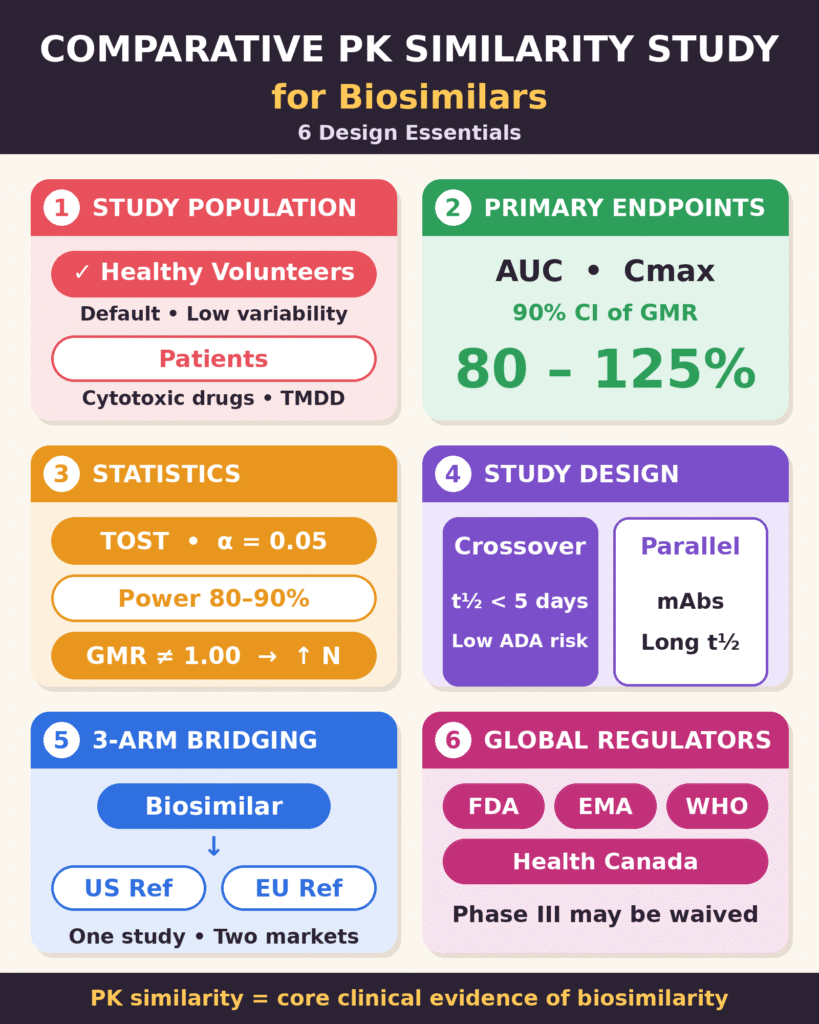
- Purpose: The comparative PK study is now the main clinical evidence for biosimilarity. Its job is to show there are no clinically meaningful differences in drug exposure between the biosimilar and the reference product, especially as the FDA and EMA move away from routinely requiring Phase III efficacy trials.
- Study population: Healthy volunteers are the default because they have low variability, which improves statistical power. Patients are used only for cytotoxic drugs, for safety reasons, or when target-mediated drug disposition (TMDD) appears only in disease states.
- Endpoints and margins: The primary endpoints are AUC and Cmax, analysed on a log-transformed scale. Similarity is shown when the 90% CI of the geometric mean ratio falls within 80.00–125.00%. Wider limits need strong scientific justification.
- Statistics and sample size: The Two One-Sided Tests (TOST) procedure at α = 0.05 is the standard approach. Sample size depends on variability, the true GMR, power (80–90%) and dropout rate. Even a 5% shift in GMR can nearly double the number of subjects needed.
- Study design: Crossover designs suit short half-life, low-immunogenicity products such as insulin and filgrastim, and can cut sample size by 50–70%. Parallel designs are needed for mAbs and long half-life proteins to avoid carryover and confounding from anti-drug antibodies (ADA).
- Three-arm bridging: Comparing the biosimilar against both the US and EU reference products in one study supports approval in multiple regions.
- Regulatory alignment: The FDA, EMA, Health Canada and WHO follow a stepwise comparability approach. Strong analytical and PK data can support waiving Phase III, which makes robust bioanalytical assays, immunogenicity monitoring and statistical rigour essential.
Study Population Selection: Healthy Volunteers versus Patient Populations
Selecting an appropriate study population for a comparative PK study requires identifying the most sensitive human model capable of detecting subtle differences in formulation, structure, or manufacturing between the biosimilar and its reference product. In most clinical development programs, healthy volunteers are the preferred population because of their physiological homogeneity, whereas patient populations are reserved for biotherapeutics associated with substantial toxicity risks or target-mediated clearance mechanisms that occur exclusively in disease states.
Population Selection Strategies in Designing a Comparative PK Similarity Study for Biosimilars
When Designing a Comparative PK Similarity Study for Biosimilars, testing in healthy volunteers is the default strategy whenever it is ethically and clinically appropriate. This approach minimizes confounding biological variables, including organ dysfunction, baseline inflammatory status, and concomitant medication use. Healthy subjects generally exhibit more predictable clearance kinetics and lower baseline variability, reducing background noise and improving statistical power.
Study Population Selection Matrix
| PARAMETER | HEALTHY VOLUNTEERS | PATIENT POPULATION |
|---|---|---|
| Baseline Homogeneity | High (minimal background noise) | Low (disease heterogeneity) |
| Inter-Subject PK Variance | Low (optimizes sample size) | High (requires larger N) |
| Target Receptor Saturation (TMDD) | Predictable / minimal | Variable / pathological |
| Ethical / Safety Feasibility | High (for non-cytotoxic agents) | Required for cytotoxic agents |
| Concomitant Medication Interference | Controlled / excluded | Common / confounding |
| Anti-Drug Antibody (ADA) Baseline | Low pre-existing reactivity | Immunosuppressed or altered |
Pathophysiological factors can influence the disposition of therapeutic proteins, complicating pharmacokinetic comparability assessments. Monoclonal antibodies (mAbs) targeting cell-surface receptors, such as HER2, CD20, or TNF-α, frequently exhibit target-mediated drug disposition (TMDD). In disease states characterized by fluctuating receptor burdens or variable tumor mass, nonlinear receptor-mediated clearance can dominate systemic clearance (\(CL\)). This may mask differences in drug exposure arising from manufacturing processes or glycosylation patterns.
Furthermore, global guidelines issued by the World Health Organization (WHO), FDA, and EMA emphasize the importance of standardizing demographic factors, including body mass index (BMI), age, biological sex, and ethnicity, to support comparability between study arms and minimize the influence of demographic differences on pharmacokinetic clearance. Single-dose studies in healthy subjects generally provide high analytical sensitivity for detecting differences in exposure. Multiple-dose studies in patient populations are reserved for circumstances in which safety considerations preclude administration to healthy individuals, such as with cytotoxic oncology drugs, or when nonlinear accumulation kinetics emerge only after repeated dosing.
Because glycosylation can influence the disposition and biological activity of therapeutic proteins, assess these structural differences as part of the broader comparability strategy. Review glycosylation analysis of biosimilars for further details on evaluating glycan-related attributes.
Bioequivalence Endpoints and Equivalence Margins
Pharmacokinetic similarity is formally established when the 90% confidence interval (CI) for the geometric mean ratio (GMR) of the primary exposure endpoints falls entirely within the standard bioequivalence limits of 80.00% to 125.00%. Any modification or expansion of these equivalence limits requires a comprehensive scientific justification supported by exposure-response modeling and, where appropriate, prior consultation with regulatory authorities.
Setting Equivalence Margins when Designing a Comparative PK Similarity Study for Biosimilars
When Designing a Comparative PK Similarity Study for Biosimilars, primary exposure endpoints must be log-transformed before statistical analysis to accommodate the skewed, approximately log-normal distributions commonly observed in biotherapeutic pharmacokinetic parameters.
PK Metrics and Regulatory Acceptance Criteria
| PK Metric | Parameter Definition | Primary vs. Secondary Status | Regulatory Acceptance Criteria |
|---|---|---|---|
| AUC0−last | Area under the concentration-time curve from zero to the last quantifiable concentration | Primary | 90% CI of GMR within 80.00%–125.00% |
| AUC0−∞ | Area under the concentration-time curve extrapolated to infinity | Primary (single dose) | 90% CI of GMR within 80.00%–125.00% |
| Cmax | Maximum observed serum concentration | Primary | 90% CI of GMR within 80.00%–125.00% |
| AUC0−τ,ss | Steady-state AUC over the dosing interval τ | Primary (multiple dose) | 90% CI of GMR within 80.00%–125.00% |
| t1/2 | Terminal elimination half-life | Secondary | Descriptive / comparability evaluation |
| CL/F | Apparent systemic clearance | Secondary | Descriptive / PK modeling support |
On the log-transformed scale, the standard multiplicative bioequivalence interval of \([0.80, 1.25]\) corresponds to symmetric additive limits, as shown below:
[ln(0.80), ln(1.25)] = [−0.2231, +0.2231]
Regulatory authorities generally apply the 80.00%–125.00% equivalence limits to both \(AUC\) and \(C_{\max}\) metrics in conventional bioequivalence assessments. Expanding the equivalence limits, for example, to 75.00%–133.33%, may be permitted in certain highly variable drug product studies when the intra-subject coefficient of variation (\(CV\)) exceeds 30%. Such an approach requires appropriate scientific justification and must be supported by assessments of clinical safety and the therapeutic window to establish that the wider range of exposure variability is unlikely to affect clinical outcomes. The applicability of reference-scaled approaches depends on the relevant regulatory framework and study design.
Structural and functional differences can affect the interpretation of comparative results. Learn how critical quality attributes in biosimilars help guide the selection of relevant analytical characteristics for a comprehensive similarity assessment.
Statistical Framework and Sample Size Optimization
Determining the required sample size for a biosimilar comparative PK study involves the Two One-Sided Tests (TOST) procedure, which assesses whether the data support equivalence within predefined limits at a significance level of \(\alpha = 0.05\). The principal factors influencing sample size include intra-subject or inter-subject variability, the anticipated true treatment difference expressed as the GMR, the desired statistical power (\(1-\beta\)), and the expected subject withdrawal rate.
Sample Size Calculations for Designing a Comparative PK Similarity Study for Biosimilars
Calculating the number of subjects required when Designing a Comparative PK Similarity Study for Biosimilars involves applying the TOST statistical framework. This framework evaluates non-equivalence through two separate one-sided tests, as represented by the following hypotheses:
H0: |μT − μR| ≥ δ vs. H1: |μT − μR| < δ
Here, μT and μR represent the log-transformed population means for the biosimilar (Test) and reference product (Reference), respectively. The parameter δ = ln(1.25) = 0.2231 defines the upper equivalence boundary under the standard symmetric log-scale equivalence framework.
The following expression provides a standard approximate sample size calculation for each treatment arm in a parallel, two-group equivalence trial:
n = 2 · σ2 · (z1−α + z1−β/2)2 (δ − |μT − μR|)2
Where:
- σ = √(ln(CV2 + 1)) represents the standard deviation of the log-transformed metric, with CV expressed as a proportion rather than a percentage.
- z1−α is the standard normal quantile corresponding to the one-sided significance level (α = 0.05, z0.95 = 1.645).
- z1−β/2 represents the quantile associated with the specified statistical power (1 − β).
- |μT − μR| = |ln(GMR)| represents the assumed true difference between the products on the log-transformed scale.
Biostatistical research indicates that standard approximate sample size formulas may be conservative and can produce actual statistical power that exceeds the nominal target (1 − β). Consequently, biostatisticians should consider exact power calculations using bivariate normal integration or non-central t-distribution methods, as appropriate to the study design and statistical assumptions, to avoid unnecessary subject enrollment while maintaining the desired power.
Sample Size Sensitivity Matrix (Parallel Design)
| VARIABILITY (CV %) | TRUE GMR (GMR = T/R) | SAMPLE SIZE PER ARM (n), POWER = 80% (\(\alpha = 0.05\)) | TOTAL EVALUABLE N, POWER = 90% (\(\alpha = 0.05\)) |
|---|---|---|---|
| 15% | 1.00 (0% difference) | 18 | 24 |
| 15% | 1.05 (5% difference) | 32 | 44 |
| 15% | 1.10 (10% difference) | 108 | 146 |
| 25% | 1.00 (0% difference) | 48 | 64 |
| 25% | 1.05 (5% difference) | 86 | 116 |
| 25% | 1.10 (10% difference) | 292 | 394 |
| 35% | 1.00 (0% difference) | 92 | 124 |
| 35% | 1.05 (5% difference) | 164 | 222 |
| 35% | 1.10 (10% difference) | 560 | 756 |
As illustrated in the matrix, the required sample size increases substantially when the true GMR deviates from 1.00. A 5% shift in the true GMR, represented by a ratio of 1.05, can nearly double the required number of subjects compared with a ratio of 1.00 under certain variability and design assumptions. This highlights the importance of achieving close analytical and formulation comparability before initiating clinical trials. The figures presented in the matrix should be verified against the intended statistical design, variance assumptions, equivalence limits, and power calculation method before being used in a clinical protocol.
A well-planned analytical comparability exercise can help identify potential differences before clinical resources are committed. See how biosimilar comparability studies support the systematic evaluation of structural and functional similarity.
Study Design Architecture: Crossover versus Parallel Approaches
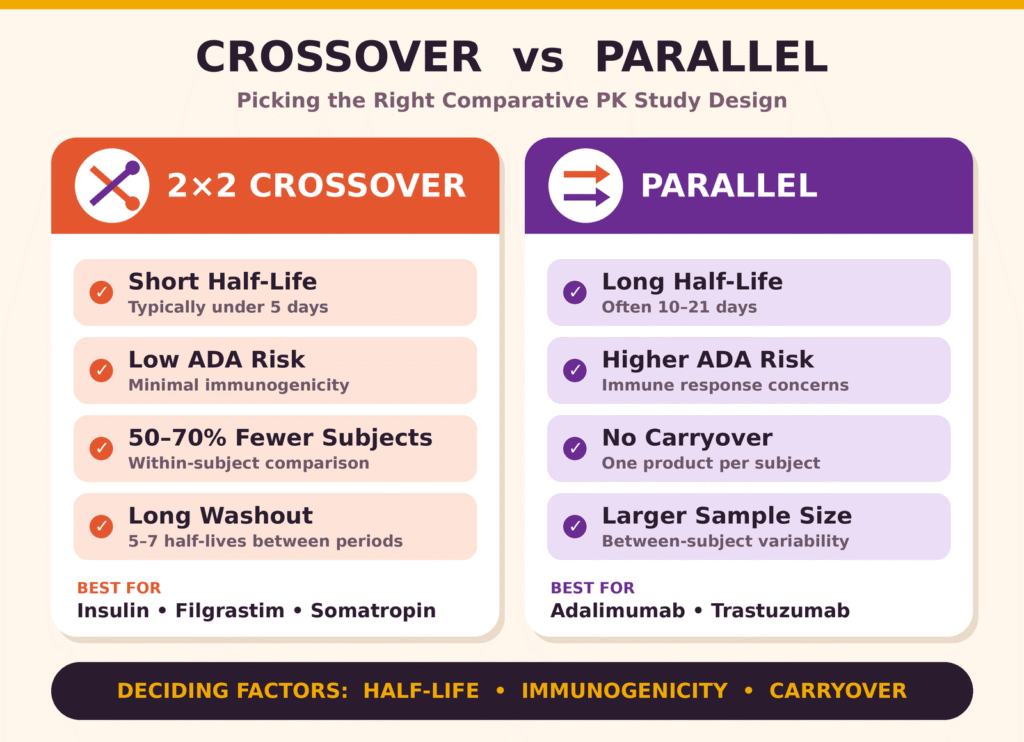
The selection of a crossover or parallel study design depends on the molecule’s elimination half-life, immunogenicity profile, and potential for exposure carryover between dosing periods. Crossover designs can reduce variability by evaluating within-subject differences, whereas parallel designs are generally necessary for biotherapeutics with long elimination half-lives or persistent immune responses.
2 × 2 Crossover Design Features
Indication Fit: This design is suitable for biotherapeutics with short elimination half-lives (t1/2 < 5 days), linear, non-saturable kinetics, and a low risk of immunogenicity. Examples include recombinant human insulins, filgrastim, and somatropin, when their pharmacokinetic and safety characteristics support a crossover approach.
Statistical Advantage: A crossover design controls for inter-subject variability by using within-subject variance (\(\sigma_{\text{within}}\)) to compare the test and reference products. Depending on the variability structure and study assumptions, this approach may reduce sample size requirements by approximately 50%–70% compared with a parallel design.
Operational Constraints: An extended washout period, typically at least five to seven elimination half-lives, is required to minimize carryover. If anti-drug antibodies develop during Period 1, changes in clearance kinetics may affect the results obtained in Period 2, potentially compromising the validity of within-subject comparisons.
Parallel Group Design Features
Indication Fit: Parallel designs are generally appropriate for monoclonal antibodies, Fc-fusion proteins, and long-acting pegylated proteins characterized by extended elimination half-lives (t1/2 = 10–21 days) or a substantial immunogenicity risk. Examples include adalimumab, trastuzumab, and ustekinumab.
Statistical Advantage: This approach avoids crossover-related carryover effects and prevents immune responses triggered by an initial dose from directly confounding the subsequent pharmacokinetic assessment period.
Operational Constraints: Parallel designs depend on inter-subject variability (σbetween) and generally require larger sample sizes to maintain statistical power of 80% or 90%, depending on the study objectives and assumptions.
Three-Arm Bridging Strategies
For biosimilar developers seeking authorization in multiple jurisdictions, such as the FDA and EMA, protocols may incorporate a three-arm parallel bridging design involving the following products:
- Proposed biosimilar candidate
- U.S.-licensed reference product
- EU-authorized reference product
Conducting three-way pairwise pharmacokinetic comparisons can help establish clinical comparability across jurisdictions and provide a scientific bridge between reference products sourced from different regions. The study design and resulting evidence must adequately justify the relevance of the bridging data for the intended regulatory submissions.
Global Regulatory Harmonization and Policy Evolution
Global regulatory agencies, including the FDA, EMA, Health Canada, and WHO, have increasingly aligned their clinical development expectations with a stepwise comparability approach. Under this framework, comparative human PK studies serve as a principal source of clinical evidence supporting biosimilarity. Recent guidance developments have also created opportunities to waive comparative Phase III clinical efficacy trials when comprehensive analytical comparability and human PK assessments demonstrate a sufficiently high degree of similarity, subject to the requirements of the applicable regulatory authority.
Global Regulatory Policy Alignment Matrix
| REGULATORY AGENCY | PRIMARY CLINICAL FOCUS | EFFICACY TRIAL WAIVER | ACCEPTED BRIDGING COMPARATORS |
|---|---|---|---|
| US FDA | PK/PD and immunogenicity similarity | Permitted when PK and analytical data sufficiently support similarity | U.S.-licensed reference product or bridging to an EU reference product through a three-way study |
| EMA (Europe) | Tailored clinical approach centered on PK | May be supported for adequately characterized mAbs when the totality of evidence justifies the approach | EU-authorized reference product or a foreign reference product supported by a scientifically justified bridge |
| Health Canada (PDD) | Comparative PK/PD in a sensitive population | Case-by-case justification supported by analytical evidence | Canadian reference product or an appropriate foreign equivalent supported by bridging data |
| WHO | Stepwise comparability paradigm | May be supported when PK/PD and the totality of evidence establish similarity | Globally recognized reference product supported by the required comparative dossier |
Modern regulatory science recognizes that comparative clinical efficacy endpoints, such as overall response rate or progression-free survival, may be less sensitive than direct, side-by-side pharmacokinetic exposure assessments for detecting certain subtle molecular differences. Consequently, clinical pharmacology programs must prioritize robust bioanalytical assay validation, precise immunogenicity monitoring, and rigorous control of statistical parameters. These elements are essential for generating reliable evidence that supports the overall demonstration of biosimilarity.
Integrating analytical characterization, comparative PK data, and regulatory documentation is essential for a coherent submission strategy. Review the end-to-end biosimilar analytical package for a regulatory submission to understand how analytical evidence can be organized to support regulatory assessment.
Conclusion
Successfully Designing a Comparative PK Similarity Study for Biosimilars requires the careful alignment of sensitive population selection, scientifically justified bioequivalence boundaries, and accurate sample size modeling to support regulatory approval. As clinical pharmacology assumes an increasingly important role in biosimilar development and comparative efficacy trials may be waived when scientifically justified, bioanalytical precision and statistical rigor remain essential for demonstrating that no clinically meaningful differences exist between the proposed biosimilar and its reference product.
Sponsors seeking to reduce clinical development risks should collaborate with experienced bioanalytical and clinical pharmacology partners to optimize trial design, strengthen assay performance, and achieve appropriate statistical power. Careful planning can improve the reliability of pharmacokinetic comparisons while supporting the preparation of a scientifically robust regulatory submission.
For support with analytical characterization and comparative testing strategies, explore specialized biosimilar characterization services to help strengthen the evidence supporting your development program.
To discuss biosimilar trial design, assay validation, and quantitative bioanalytical strategies, contact the clinical pharmacology team at ResolveMass Laboratories Contact Page.
Frequently Asked Questions
Healthy volunteers generally provide more consistent physiological conditions than patients, reducing variability caused by disease severity, concurrent medications, and organ dysfunction. This consistency can improve the study’s ability to detect small differences between products. However, patient populations may be necessary when safety concerns or disease-specific pharmacology make healthy-volunteer studies unsuitable.
The Two One-Sided Tests (TOST) procedure is commonly used to assess pharmacokinetic equivalence at a significance level of \(\alpha = 0.05\). The analysis examines whether the 90% confidence interval for the geometric mean ratio (GMR) lies entirely within the predefined equivalence limits. Both the study design and statistical assumptions must support a valid interpretation of the results.
The conventional equivalence interval is 80.00% to 125.00% for the geometric mean ratio of key pharmacokinetic endpoints. The 90% confidence intervals for parameters such as AUC and \(C_{\max}\) must fall entirely within these limits when this standard approach applies. Any alternative margins must be scientifically justified and consistent with the relevant regulatory requirements.
Target-mediated drug disposition occurs when a therapeutic molecule binds to its biological target and undergoes target-related elimination. This process can produce nonlinear pharmacokinetics because clearance may change with drug concentration and target availability. Study designers must consider dose selection, receptor expression, and disease-related differences to avoid obscuring meaningful exposure differences between the biosimilar and reference product.
A parallel design is generally preferred for biologics with long elimination half-lives, including many monoclonal antibodies, or when persistent immune responses may influence subsequent treatment periods. Crossover studies can require lengthy washout periods and may be compromised if anti-drug antibodies develop after the first administration. A parallel approach avoids these carryover concerns, although it may require more participants to account for between-subject variability.
Anti-drug antibodies can alter a therapeutic protein’s clearance, circulating concentration, and elimination half-life. Depending on their characteristics, they may also affect biological activity or contribute to safety concerns. Measuring immunogenicity alongside pharmacokinetic endpoints helps investigators determine whether immune responses influence the comparability of the two products.
Pharmacokinetic measurements such as AUC and \(C_{\max}\) often show right-skewed distributions, making logarithmic transformation useful for statistical analysis. Transformation allows treatment differences to be assessed on a multiplicative scale and supports estimation of geometric mean ratios. The resulting data can then be evaluated using appropriate statistical methods, including analysis of variance and TOST.
Higher pharmacokinetic variability generally requires more participants to demonstrate equivalence with the desired statistical power. Sample size also increases when the anticipated geometric mean ratio moves farther from 1.00, leaving less room between the expected treatment difference and the equivalence boundary. Researchers must also account for participant withdrawals, the selected study design, and the required confidence level.
Yes. Depending on the applicable regulatory framework, a sufficiently sensitive comparative PK study, supported by comprehensive analytical and functional similarity data, may contribute to a justification for waiving a comparative Phase III efficacy trial. Immunogenicity and other relevant clinical evidence must also be considered where required. A waiver is not automatic; regulators assess the totality of evidence and the scientific rationale for the proposed development strategy.
Reference:
- European Medicines Agency. (2015). Guideline on similar biological medicinal products containing biotechnology-derived proteins as active substance: Non-clinical and clinical issues (Revision 1) (EMEA/CHMP/BMWP/42832/2005 Rev. 1). https://www.ema.europa.eu/en/documents/scientific-guideline/guideline-similar-biological-medicinal-products-containing-biotechnology-derived-proteins-active-substance-non-clinical-and-clinical-issues-revision-1_en.pdf
- U.S. Food and Drug Administration. (2026, May). Statistical approaches to establishing bioequivalence: Guidance for industry. U.S. Department of Health and Human Services. https://www.fda.gov/media/163638/download
- Kang, S.-H., & Kim, Y. (2014). Sample size calculations for the development of biosimilar products. Journal of Biopharmaceutical Statistics, 24(6), 1215–1224. https://doi.org/10.1080/10543406.2014.941984
- European Medicines Agency. (2024). Absimky: EPAR—Public assessment report (EMA/511029/2024). https://www.ema.europa.eu/en/documents/assessment-report/absimky-epar-public-assessment-report_en.pdf
- European Medicines Agency. (2017, May 18). Ogivri: Withdrawal assessment report (EMA/305022/2017). https://www.ema.europa.eu/en/documents/withdrawal-report/withdrawal-assessment-report-ogivri_en.pdf
Get In Touch With Us
About The Author