
Introduction
Evaluating a peptide purity testing report requires a systematic review of analytical parameters to distinguish raw chromatographic purity from active peptide content, structural integrity, and counterion burden. In modern analytical workflows, such as those demonstrated in a Polymorph Identification Case Study CDMO, contract development and manufacturing organizations (CDMOs) implement rigorous characterization protocols to ensure that synthetic peptides comply with pharmacopeial standards established by the USP, Ph. Eur., and ICH guidelines. A comprehensive Certificate of Analysis (COA) serves as the primary legal and technical document for verifying sequence identity, chemical purity, and physical stability before a peptide is used in biological or pharmaceutical applications.
Relying exclusively on a headline purity value, such as “98% HPLC purity,” without examining net peptide content, counterion burden, residual moisture, and solid-state structure can introduce experimental artifacts, inconsistent dosing, and reduced assay reproducibility. High-precision characterization frameworks, such as those implemented at ResolveMass Laboratories Inc., provide the analytical depth required to interpret complex peptide datasheets and identify concealed contaminants or structural ambiguities.
For a deeper understanding of peptide characterization methods, explore our peptide analytical testing services.
Share via:
Quick Summary:
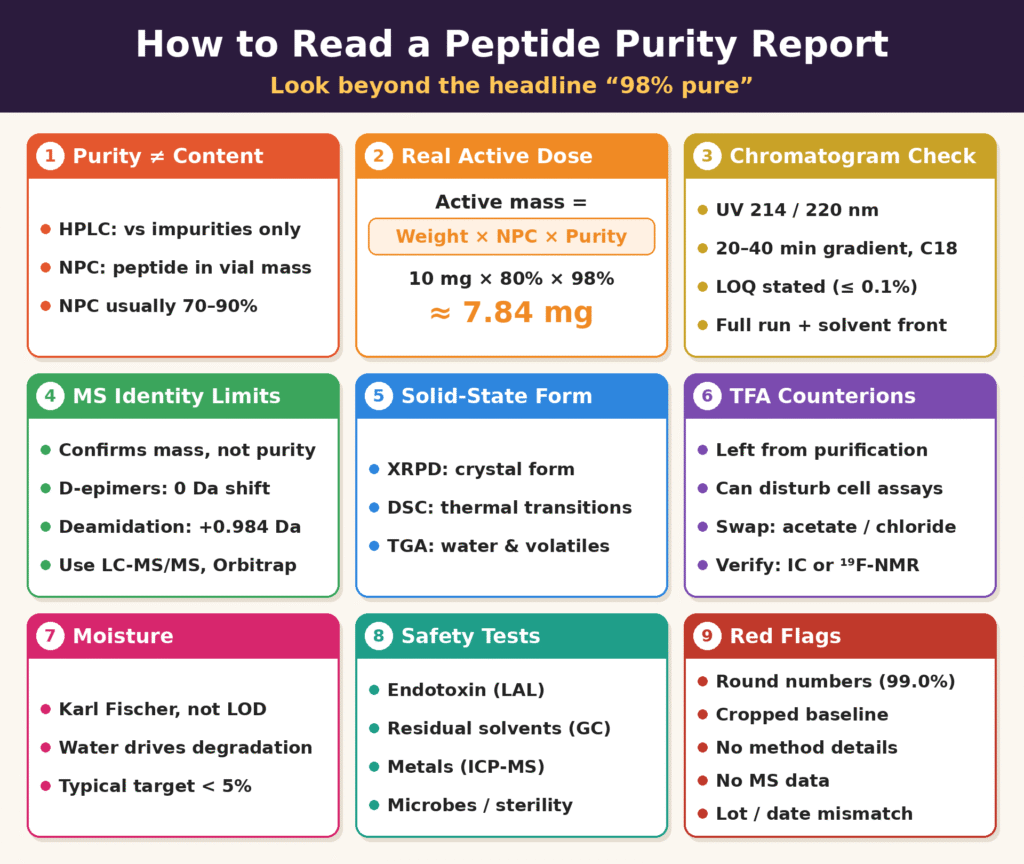
- HPLC purity ≠ actual peptide amount. HPLC purity only compares the target peptide with other peptide impurities. Net Peptide Content (usually 70–90%) shows how much of the vial’s weight is really peptide; the rest is water, salts and counterions.
- Calculate the real active dose. Active mass = weight × NPC × HPLC purity. For example, 10 mg at 80% NPC and 98% purity gives about 7.84 mg, depending on the lab’s reporting convention.
- Audit the chromatogram, not just the number. Check for detection at 214/220 nm, an adequate gradient (20–40 min, C18), a stated LOQ, and a full run that shows the solvent front.
- Mass spectrometry confirms identity but has blind spots. It cannot reliably detect D-epimers or some isobaric impurities. LC-MS/MS or high-resolution Orbitrap helps pick up subtle changes such as deamidation (+0.984 Da).
- Solid-state form affects stability. XRPD, DSC and TGA show whether the peptide is crystalline, amorphous or hydrated, which influences solubility, moisture uptake and shelf life.
- Check counterions, moisture and safety tests. Residual TFA can interfere with cell assays and may need exchanging for acetate or chloride. Water content should be measured by Karl Fischer. Endotoxins, residual solvents, elemental impurities and microbial limits should also be tested.
- Watch for red flags in a COA. Warning signs include round-number purity values, cropped baselines, missing method details, no MS data, mismatched lot numbers or dates, and no evidence of laboratory accreditation.
Decoupling HPLC Purity and Net Peptide Content
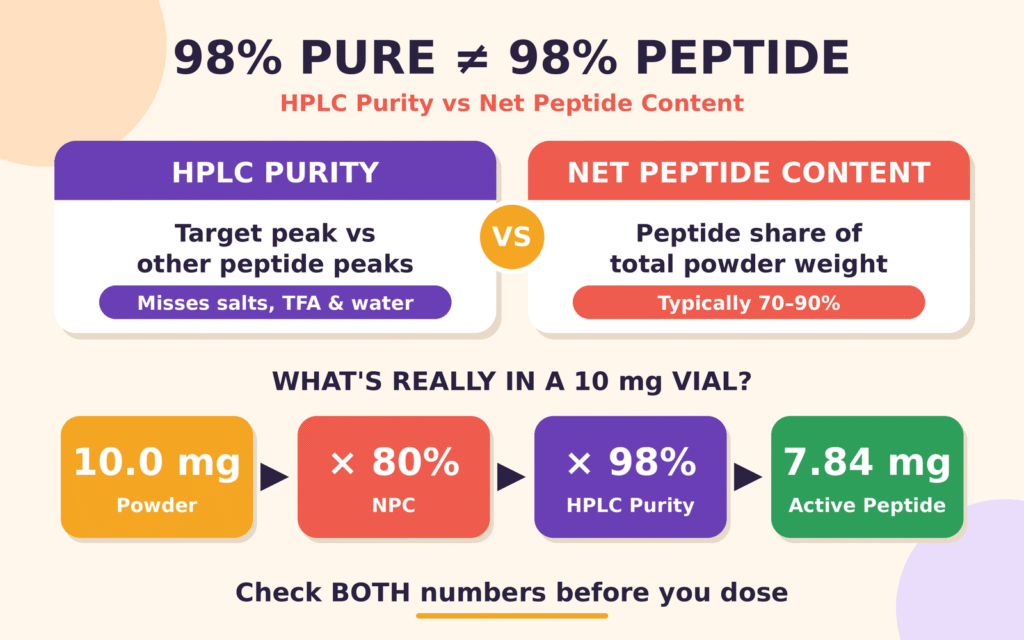
A peptide purity report must clearly distinguish HPLC purity from Net Peptide Content (NPC). HPLC purity measures the relative peak area of the target peptide compared with other detected peptidic species, whereas NPC quantifies the proportion of the total vial mass attributable to the peptide. Treating these independent measurements as interchangeable can result in significant underdosing and variability in quantitative assays.
When a Certificate of Analysis reports 98% peptide purity by Reversed-Phase HPLC (RP-HPLC), this value indicates that the target peptide accounts for 98% of the integrated UV-absorbing peptidic peak area under the specified analytical conditions. However, RP-HPLC with UV detection does not account for non-chromophoric or non-peptidic materials, including residual trifluoroacetate (TFA) counterions, inorganic salts, organic solvents, and bound moisture absorbed during lyophilization.
The Net Peptide Content of a custom or bulk synthetic peptide typically ranges from 70% to 90% of the total gross powder weight. Consequently, a lyophilized vial containing 10.0 mg of powder with 98% HPLC purity and 80% NPC contains approximately 7.84 mg of active peptide, assuming that the HPLC purity percentage can be applied as an additional correction factor to the NPC value. Calculating the active mass requires applying the standard Peptide Yield Formula:
Active Mass Formula:
Active Mass = Gross Weight × (NPC (%) / 100) × (HPLC Purity (%) / 100)
Note: The calculation above assumes that NPC and HPLC purity represent independent correction factors. In practice, the calculation must follow the laboratory’s validated reporting convention to avoid double-counting purity-related losses.
| Analytical Metric | Primary Measurement Focus | Standard Testing Method | Key Analytical Limitations |
|---|---|---|---|
| HPLC Purity (%) | Ratio of the target peptide relative to peptidic impurities, including deletion sequences, truncations, and oxidized forms. | Reversed-Phase HPLC with UV Detection at 214 or 220 nm. | Does not account for counterions, water, non-UV-absorbing salts, or co-eluting isomeric impurities. |
| Net Peptide Content (%) | Absolute percentage of the total vial mass attributable to the peptide backbone. | Quantitative Amino Acid Analysis (AAA) or Elemental Nitrogen Analysis. | Does not necessarily distinguish the intact peptide sequence from truncated peptidic impurities. |
| Mass Spectrometry Identity | Confirmation of the target molecular weight and primary sequence mass-to-charge ratio (m/z). | LC-MS, including ESI-MS, MALDI-TOF, Q-TOF, or Orbitrap. | Confirms mass-to-charge characteristics but does not independently quantify purity or reliably detect stereoisomers. |
Key Parameters for Auditing Chromatograms and Analytical Methods
Auditing an HPLC chromatogram requires checking the detection wavelength, gradient run time, column dimensions, and baseline integration to determine whether impurities have been concealed or under-reported. Without a specified Limit of Quantification (LOQ) and a complete chromatographic profile that includes the solvent front, reported purity values cannot be adequately evaluated or scientifically validated.
Detection Wavelength and Absorbance Bias
Peptide purity chromatograms are commonly monitored at 214 nm or 220 nm because peptide bonds absorb UV light strongly at these lower wavelengths. These detection wavelengths help identify a broad range of peptide-related species and reduce the selectivity limitations associated with monitoring only aromatic amino acids. Testing at 280 nm primarily detects aromatic residues, potentially leading to substantial overestimation or underestimation of impurities that contain few or no aromatic amino acids.
At 214 nm, Tryptophan can exhibit molar absorptivity approximately 30 times greater than that of an isolated peptide bond under certain conditions. Consequently, Tryptophan-containing impurities may produce disproportionately large peak areas, while deletion sequences that have lost a Tryptophan residue may be under-represented. The actual response depends on the peptide sequence and analytical conditions. Reports must explicitly identify the UV wavelength used so that the results can be interpreted in the appropriate analytical context.
Gradient Profile and Chromatographic Separation
A robust peptide HPLC assay generally uses sufficiently long gradient run times, often 20 to 40 minutes, with reverse-phase C18 columns to separate closely eluting sequence variants. Excessively short run times can cause deletion sequences, diastereomer epimers, and side-chain-modified impurities to co-elute with the principal product peak. This reduces the method’s ability to distinguish the target peptide from structurally related impurities.
Standard analytical protocols may use C18 columns measuring 4.6 × 150 mm or 4.6 × 250 mm, with particle sizes ranging from 3.5 µm to 5 µm. A typical method may employ an acetonitrile gradient ranging from 5% to 65%, containing 0.1% TFA, over 20 to 40 minutes. Column temperatures are commonly controlled within a range of 25°C to 40°C. These parameters must be optimized and validated for the specific peptide because sequence composition, hydrophobicity, and impurity profiles influence chromatographic separation.
Learn how specialized laboratories support peptide quality assessment through custom peptide synthesis and analytical workflows.
Limit of Quantification (LOQ) and Baseline Integration
A reliable chromatographic datasheet should specify the Limit of Quantification (LOQ), with a value of ≤0.1% where the method is intended to quantify impurities at that level. This helps demonstrate whether minor impurities can be distinguished from integration noise and quantified with appropriate accuracy and precision. Analysts should also verify that baseline integration follows predefined, scientifically justified rules and that the chromatogram includes the solvent front near the beginning of the run.
Regulatory expectations for impurity quantification depend on the applicable guideline, substance, and reporting context. An LOQ of 0.1% may be appropriate for certain chromatographic purity methods, but it should not be treated as a universal requirement for every peptide or analytical application. A certificate reporting 99.2% purity without specifying the LOQ or providing adequate signal-to-noise (S/N) information offers insufficient evidence to establish whether trace impurities can be reliably detected and quantified.
Furthermore, the chromatogram should display the complete analytical run, beginning at \(t_0\), so that the solvent front and relevant early-eluting signals can be assessed. The absence of the solvent front may indicate that the image has been selectively cropped or that the displayed chromatogram does not represent the complete instrument output. However, the absence of a visible solvent front alone does not prove that the chromatogram is fabricated, as instrument settings and data-processing procedures may affect its appearance.
For additional information on analytical approaches used to identify peptide-related impurities, review our impurity control strategies under ICH Q3A.
Solid-State Integrity and Structural Analysis in a Polymorph Identification Case Study CDMO
Solid-state characterization and high-resolution mass spectrometry are essential for determining whether a synthetic peptide has the intended molecular structure and appropriate physical form. Data obtained through a Polymorph Identification Case Study CDMO can demonstrate how differences in physical state influence peptide dissolution rates, hygroscopicity, and long-term chemical stability. Evaluating these characteristics alongside chromatographic purity provides a more complete understanding of peptide quality.
Mass Spectrometry Identity and Structural Blind Spots
Mass spectrometry supports peptide sequence identification by measuring molecular mass and characteristic mass-to-charge ratios. However, conventional mass spectrometry cannot reliably distinguish every structural variant, particularly isobaric impurities, D-epimers, and certain rearrangement products such as aspartimide-related species. Tandem mass spectrometry (LC-MS/MS) and high-resolution Orbitrap mass spectrometry can provide additional information to help identify subtle sequence modifications, deamidation events, and other structural differences.
- D-Amino Acid Epimers: These may arise from racemization during solid-phase peptide synthesis (SPPS). Because epimerization changes stereochemistry without changing elemental composition, the resulting peptide generally exhibits a mass shift of 0.00 Da.
- Aspartimide Formation: This is a common cyclic rearrangement associated with Asp-containing sequences, particularly susceptible Asp-Gly motifs, during peptide synthesis. Aspartimide formation itself does not necessarily produce a detectable mass shift of 0.00 Da relative to the corresponding peptide composition; subsequent hydrolysis or rearrangement products may have different analytical characteristics.
- Deamidation Products: Conversion of Asn to Asp or isoAsp, or Gln to Glu, typically produces a mass increase of approximately +0.984 Da. High-resolution mass spectrometry, such as Q-TOF or Orbitrap analysis, can help distinguish this change from the isotopic mass distribution, although additional analytical techniques may be needed to differentiate certain positional isomers.
Solid-State Characterization in a Polymorph Identification Case Study CDMO
Incorporating solid-state analytical techniques, such as X-Ray Powder Diffraction (XRPD) and Differential Scanning Calorimetry (DSC), enables researchers to determine whether a peptide exists in a crystalline, amorphous, or solvated form. Findings from a Polymorph Identification Case Study CDMO can illustrate how controlling polymorphic transformations helps reduce batch-to-batch differences in solubility and minimizes risks associated with solid-state degradation.
According to ICH Q6A, decision-tree approaches help determine when solid-state characterization and polymorph screening are necessary, particularly when physical properties may affect drug substance performance. Peptide active pharmaceutical ingredients (APIs) may exist as distinct polymorphs, amorphous powders, or hydrated pseudopolymorphs. Comprehensive characterization datasheets can incorporate the following techniques:
- X-Ray Powder Diffraction (XRPD): Identifies characteristic crystalline lattice reflections and helps distinguish crystalline materials from those exhibiting an amorphous diffraction halo.
- Differential Scanning Calorimetry (DSC): Measures thermal transitions, including glass transition temperatures (\(T_g\)), desolvation-related endotherms, and melting events.
- Thermogravimetric Analysis (TGA): Measures mass changes during controlled heating and helps evaluate moisture and volatile content. When combined with complementary techniques, it can help distinguish surface-adsorbed water from more tightly bound water associated with crystalline hydrates.
Biological Safety, Residual Counterions, and Compendial Attributes
A comprehensive peptide testing datasheet must address relevant biological safety and quality attributes, including residual counterion levels, moisture content, bacterial endotoxins, elemental impurities, and sterility where applicable. These compendial and product-specific parameters help establish whether the material meets its intended quality requirements and is adequately controlled for potential cytotoxic contaminants, hydrolytic degradation, and pyrogenic impurities.
Residual Counterions and Trifluoroacetate (TFA) Toxicity
Synthetic peptides are commonly purified by RP-HPLC using mobile phases containing approximately 0.1% trifluoroacetic acid (TFA). During purification, TFA can associate with positively charged sites on basic amino acid residues, including Lysine, Arginine, and Histidine, and remain in the isolated peptide material as a counterion. The residual TFA concentration may influence the peptide’s suitability for particular biological applications.
Residual TFA can affect biological responses in certain experimental systems. Some studies have reported inhibitory effects on osteoblast proliferation and alterations in cellular responses at low TFA concentrations, including concentrations within the 10 nM to 100 nM range under specific experimental conditions. However, these effects depend on the cell type, exposure conditions, and experimental design; this concentration range should not be treated as a universal toxicity threshold.
For sensitive cell culture experiments or clinical applications, researchers may consider exchanging TFA for alternative counterions, such as acetate (CH₃COO⁻) or chloride (Cl⁻), when scientifically and technically appropriate. The resulting counterion composition should be verified using suitable analytical methods, such as ion chromatography (IC) or \(^{19}\text{F}\)-NMR. The acceptable residual TFA level depends on the intended application and relevant quality requirements.
Explore the analytical considerations associated with peptide testing and characterization services to support the evaluation of counterions and other peptide quality attributes.
Moisture Determination via Karl Fischer Titration
Lyophilized peptides are often hygroscopic and can absorb moisture from the surrounding atmosphere during handling, packaging, and storage. Excess residual water may promote peptide hydrolysis, beta-elimination, aggregation, and other degradation pathways, depending on the peptide’s structure and storage conditions. Accurate moisture determination is therefore important for evaluating peptide quality and establishing suitable storage conditions.
Loss on Drying (LOD) may be unsuitable as the sole method for measuring water in some peptides because heating can cause decomposition or the loss of other volatile components before all relevant water has been removed. Karl Fischer (KF) titration, including coulometric titration where appropriate, provides a more specific method for determining water content. The applicable USP procedure should be selected according to the material and analytical requirements.
Moisture acceptance criteria must be established based on the peptide’s stability profile, intended use, and validated specifications. A water content below 5.0% may be used as a general target for certain lyophilized peptide materials, while levels below 3.0% may be desirable for some formulations. These values are not universal compendial limits, and the appropriate specification should be supported by product-specific stability data.
| Safety / Quality Attribute | Standard Testing Method | Acceptance Criteria / Standard Limits | Biological / Stability Impact |
|---|---|---|---|
| Bacterial Endotoxins | Limulus Amebocyte Lysate (LAL) Assay (USP or Ph. Eur. 2.6.14, as applicable). | Product-specific limits, such as less than 0.25 EU/mL or less than 0.01 EU/mg, where appropriate for the intended application. | Helps prevent pyrogenic responses and unwanted immune activation in biological assays. |
| Residual Solvents | Headspace Gas Chromatography (GC-MS), where appropriate (ICH Q3C and applicable USP methods). | Must comply with the applicable ICH Q3C limits and relevant product-specific specifications. | Reduces the risk of cellular cytotoxicity and other adverse effects associated with residual acetonitrile, DMF, or piperidine. |
| Elemental Impurities | Inductively Coupled Plasma Mass Spectrometry (ICP-MS), using applicable USP procedures and ICH Q3D. | Must meet the applicable permitted daily exposure limits and product-specific specifications for relevant elements. | Helps control heavy metals and other elemental contaminants, including Pd, Pb, As, and Cd, that may pose toxicity risks. |
| Microbiological Limits | Microbial Enumeration and Sterility Testing, using applicable USP procedures. | Must comply with specified microbial limits and applicable sterility requirements for injectable products. | Helps prevent microbial contamination and reduces the risk of microbiologically mediated product degradation. |
For peptide products intended for parenteral administration, consider the importance of sterile fill-finish services for peptide injectables when evaluating manufacturing and product-quality requirements.
Red Flags and Verification Checklist for Peptide Datasheets
Assessing peptide documentation requires careful examination of reported purity values, chromatographic method details, baseline presentation, and evidence of laboratory qualification or accreditation. Reports that omit essential analytical parameters, lack batch traceability, or provide insufficient supporting data may present significant quality risks. A structured audit helps determine whether the available documentation adequately supports the peptide’s stated identity, purity, and suitability for its intended application.
| Audit Category | Compliant Quality Indicator | Red Flag / Falsification Warning |
|---|---|---|
| Data Precision | Purity percentages are reported with the precision supported by the instrument output and validated method, such as 98.37% or 99.14%. | Identical round-number purity claims, such as exactly 98.0%, 99.0%, or 100%, across multiple reports may warrant further investigation for possible manual entry or unsupported reporting. Round numbers alone do not establish falsification. |
| Chromatogram Baseline | The chromatogram includes the relevant early-eluting region, baseline behavior is appropriately documented, and clear peak-integration tables are available. | Missing early-run data, cropped axes, unexplained baseline suppression, or zeroed baseline noise without adequate justification. |
| Method Disclosure | The report identifies the column type and dimensions, mobile phase composition, flow rate, UV detection wavelength, and gradient conditions. | The report states only “Purity by HPLC” without disclosing the wavelength, column specifications, or gradient details. |
| Identity Verification | High-resolution LC-MS data include the observed mass or relevant charge envelope and deconvoluted mass, with comparison against the theoretical mass where appropriate. | The report provides only UV-HPLC data without mass spectrometry confirmation or lists a theoretical mass without supporting experimental data. |
| Batch Traceability | A unique batch or lot number matches the physical vial label and is supported by the analysis date and appropriate analyst or reviewer authorization. | Mismatched lot numbers, missing test dates, or undated reports that are more than 12 months old without evidence of material-specific retesting or current validity. |
| Facility Accreditation | Testing is performed by a suitably qualified laboratory, with ISO/IEC 17025 accreditation where applicable and independently verifiable accreditation details. | Unverified in-house reports, missing laboratory contact information, or no credible evidence of independent quality oversight where such evidence is required. |
When evaluating peptides for pharmaceutical development, documentation quality should be considered alongside manufacturing controls, analytical validation, and batch consistency. For additional context on commercial production and quality expectations, read about GMP peptide API manufacturing services.
Conclusion
Auditing a peptide purity testing datasheet requires a comprehensive assessment of chromatographic purity, active peptide mass, counterion levels, and solid-state integrity. Incorporating analytical approaches demonstrated in a Polymorph Identification Case Study CDMO supports the evaluation of synthetic peptides against applicable pharmacopeial standards and experimental quality requirements. Examining raw chromatograms, verifying net peptide content calculations, and reviewing relevant compendial safety attributes help protect experimental reproducibility and improve supply chain transparency.
For advanced peptide characterization services, analytical method validation, and expert consultation, visit the ResolveMass Laboratories Inc. contact portal:
Contact ResolveMass Laboratories Inc.
Frequently Asked Questions (FAQs)
The total weight of a lyophilized peptide includes more than the active peptide itself. Residual trifluoroacetate (TFA) counterions, inorganic salts, and moisture can contribute to the overall powder weight. Therefore, researchers should consider both NPC and HPLC purity when estimating the active peptide mass available for laboratory experiments.
Residual TFA counterions can influence cellular responses and interfere with the interpretation of sensitive biological assays. Depending on the concentration and experimental conditions, TFA may cause cytotoxic effects or alter cell behavior. When necessary, researchers can exchange TFA for alternative counterions, such as acetate or hydrochloride, and verify the resulting composition using appropriate analytical techniques.
Nominal-mass LC-MS may not distinguish structural variants that share the same molecular mass, including D-amino acid epimers and certain aspartimide-related products. These modifications can alter peptide structure without producing a detectable mass difference. Additional techniques, such as tandem mass spectrometry (LC-MS/MS), chiral chromatography, and peptide mapping, can help identify these structural differences.
A Polymorph Identification Case Study CDMO demonstrates how solid-state characterization can support peptide development by examining crystalline forms, amorphous content, and hydration states. Techniques such as X-Ray Powder Diffraction (XRPD) and Differential Scanning Calorimetry (DSC) help identify physical differences that may affect peptide performance. Understanding these characteristics supports consistent dissolution behavior, solubility, and storage stability across production batches.
Peptide purity analysis by Reversed-Phase HPLC (RP-HPLC) commonly uses UV detection at 214 nm or 220 nm because peptide bonds absorb strongly at these wavelengths. Detection at 280 nm primarily identifies peptides containing aromatic amino acids, making it less suitable for detecting certain non-aromatic impurities. Selecting an appropriate wavelength improves impurity detection and supports more reliable chromatographic purity assessment.
Endotoxin acceptance limits depend on the intended application, route of administration, dose, and applicable regulatory requirements. The Limulus Amebocyte Lysate (LAL) assay is commonly used to measure bacterial endotoxins in accordance with relevant USP procedures. Researchers should establish product-specific limits to minimize pyrogenic responses and unwanted immune activation, particularly when preparing peptides for injectable applications.
Karl Fischer (KF) titration specifically measures water content through a chemical reaction, whereas Loss on Drying (LOD) measures the total mass lost during heating. LOD may overestimate moisture when other volatile substances are present or underestimate it when water remains bound within the material. Karl Fischer titration is often preferred for peptide moisture analysis because it provides a more selective measurement of water when the method is suitable for the sample.
Warning signs in a Peptide Certificate of Analysis (COA) include repeated round-number purity claims, incomplete chromatograms, missing analytical wavelength information, and an unstated Limit of Quantification (LOQ). Mismatched batch numbers, missing test dates, and unverifiable laboratory accreditation details also warrant further investigation. These issues do not automatically prove manipulation, but they indicate that additional documentation and independent verification may be necessary.
ISO/IEC 17025 accreditation demonstrates that a testing laboratory has been independently assessed for its technical competence and ability to produce reliable results within its accredited scope. It evaluates factors such as analytical method performance, equipment control, personnel competence, and quality management practices. For peptide testing, this accreditation can strengthen confidence in reported HPLC purity, LC-MS identity, and other analytical results, provided the relevant tests fall within the laboratory’s accredited scope.
Reference:
- International Council for Harmonisation of Technical Requirements for Pharmaceuticals for Human Use. (1999, October 6). Specifications: Test procedures and acceptance criteria for new drug substances and new drug products: Chemical substances (Q6A). https://database.ich.org/sites/default/files/Q6A%20Guideline.pdf
- International Council for Harmonisation of Technical Requirements for Pharmaceuticals for Human Use. (1999). Q6A decision trees: Specifications—Test procedures and acceptance criteria for new drug substances and new drug products: Chemical substances. https://database.ich.org/sites/default/files/Q6A%20Decision%20Tree.pdf
- European Medicines Agency. (2000, May). ICH Q 6 A: Test procedures and acceptance criteria for new drug substances and new drug products: Chemical substances (Step 5). https://www.ema.europa.eu/en/documents/scientific-guideline/ich-q-6-test-procedures-and-acceptance-criteria-new-drug-substances-and-new-drug-products-chemical-substances-step-5_en.pdf
- European Medicines Agency. (n.d.). ICH Q6A specifications: Test procedures and acceptance criteria for new drug substances and new drug products: Chemical substances. https://www.ema.europa.eu/en/scientific-guidelines/ich-q6a-specifications-test-procedures-acceptance-criteria-new-drug-substances-new-drug-products-chemical-substances
Get In Touch With Us
About The Author