Introduction:
A reliable peptide purity testing report should provide a complete analytical overview that confirms peptide identity, purity, composition, and stability. Essential data typically includes validated High-Performance Liquid Chromatography (HPLC) chromatograms, High-Resolution Mass Spectrometry (HRMS) results, quantitative peptide content analysis, and counterion measurements. Together, these analytical parameters help reduce the risk of Biosimilar Comparability Failure by confirming that the synthetic or recombinant peptide matches the intended molecular structure and impurity profile of the reference product.
Share via:
Executive Summary:
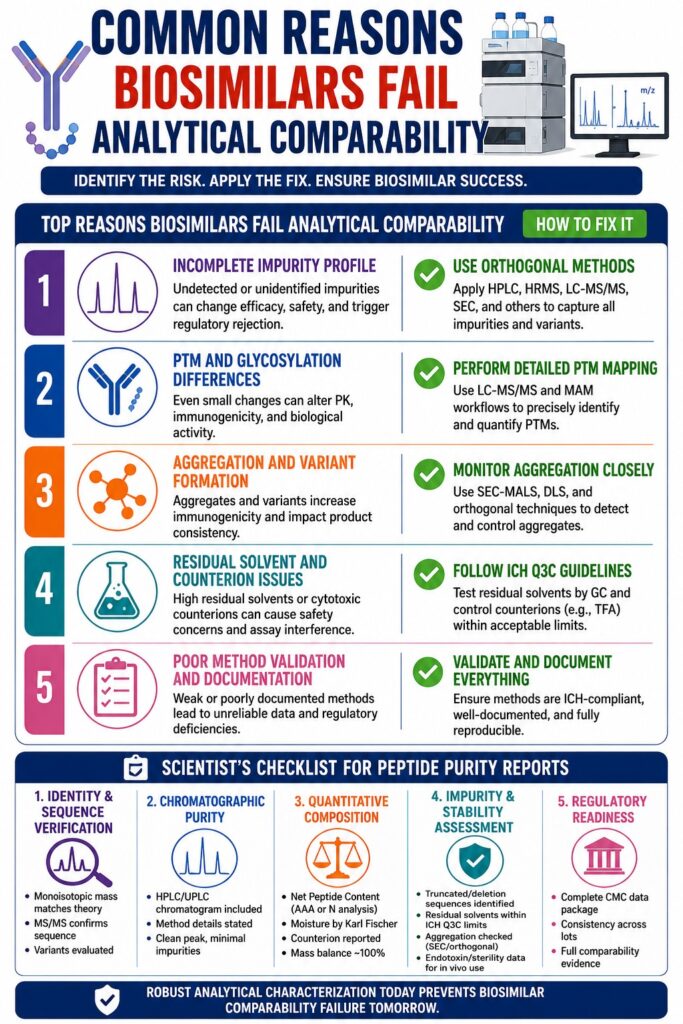
- Analytical characterization is critical for biosimilar success because biosimilars must closely match the reference biologic in structure, purity, stability, and functional performance to avoid regulatory or clinical failure.
- HPLC and Mass Spectrometry are key analytical tools used to confirm peptide purity, molecular identity, sequence accuracy, impurity profiles, and post-translational modifications (PTMs).
- Chromatographic purity alone is not sufficient since a peptide may appear pure by HPLC while still containing incorrect sequences or hidden impurities; detailed chromatograms and validated methods are essential.
- Mass spectrometry and MS/MS peptide mapping help detect sequence variations, deamidation, oxidation, and structural changes that may affect biological activity, pharmacokinetics, or immunogenicity.
- Net Peptide Content (NPC), moisture, counterions, and residual solvents must be carefully measured because inaccurate composition or excess solvents can lead to dosing errors, instability, toxicity, and biosimilar comparability failure.
- Aggregation analysis and PTM characterization are major regulatory requirements since aggregates and molecular modifications can alter safety, efficacy, and long-term product stability.
- Future biosimilar development will rely heavily on advanced LC-MS/MS, Multi-Attribute Methods (MAM), AI-driven analytics, and real-time process monitoring to improve manufacturing consistency, regulatory compliance, and overall biosimilarity assessment.
Why Analytical Characterization Matters in Biosimilar Development
Preventing Biosimilar Comparability Failure depends heavily on a comprehensive analytical characterization strategy. Biosimilars must demonstrate a high degree of similarity to the reference biologic across all critical quality attributes (CQAs). Since biologics and complex peptides are manufactured through living systems or sophisticated chemical synthesis, even minor process variations can alter molecular structure, potency, efficacy, or safety.
Modern regulatory frameworks, including ICH Q6B guidance, emphasize analytical “fingerprinting” rather than a simple pass-or-fail comparison. This approach establishes a multidimensional molecular profile that supports the “totality of evidence” required for regulatory approval.
Explore our deep dive on defining quality standards: Understanding Critical Quality Attributes (CQAs) in Biosimilars
Analytical characterization also reduces the financial and clinical risks associated with failed biosimilar submissions. Regulatory agencies such as the FDA and EMA increasingly rely on advanced structural and functional data to minimize the need for lengthy clinical studies. However, this reduced dependence on clinical trials is only possible when analytical evidence is exceptionally robust.
Many documented cases of Biosimilar Comparability Failure have been linked to incomplete characterization of the reference product or insufficient process controls that resulted in inconsistent impurity patterns.
| Analytical Parameter | Purpose in Biosimilarity Assessment | Potential Impact of Failure |
|---|---|---|
| Primary Sequence | Confirms identical amino acid sequence | Reduced biological activity or receptor binding |
| Purity Profile | Measures target peptide relative to impurities | Unexpected adverse effects |
| Impurity Identification | Detects structural variants | Toxicological or immunogenic concerns |
| Glycosylation/PTMs | Characterizes molecular modifications | Altered pharmacokinetics and half-life |
| Aggregation State | Detects dimers and higher-order species | Increased immunogenicity risk |
Ensure your development stays on track: How to Prevent Biosimilar Comparability Failure with Advanced Studies
Chromatographic Purity: The First Quality Benchmark
HPLC purity measures the percentage of UV-detectable material corresponding to the desired peptide. For example, a peptide reported as 98% pure by HPLC means that 98% of the detected signal originates from the target peptide peak, while the remaining 2% consists of related impurities or byproducts.
Understanding the HPLC Chromatogram
A trustworthy peptide purity report should always include both the chromatogram and the analytical method used to generate it. Purity values without method details are incomplete because chromatographic separation depends heavily on factors such as:
- Column chemistry
- Mobile phase composition
- Gradient conditions
- Detection wavelength
A peptide that appears highly pure using one chromatographic method may reveal additional impurities under different analytical conditions.
The chromatogram itself provides valuable insight:
- The x-axis represents retention time ($R_t$), which functions as a molecular fingerprint under fixed conditions.
- The y-axis shows detector response in milli-absorbance units (mAU).
A clean, symmetrical peak generally indicates effective purification. In contrast, peak tailing or shoulder peaks may indicate co-eluting impurities such as deletion sequences or truncated peptides. These impurities can contribute to Biosimilar Comparability Failure if they exhibit altered biological properties.
Learn how to validate your purity results: Proving Biosimilarity Using Advanced LC-MS Techniques
Recommended Purity Levels by Application
The acceptable purity threshold depends on the intended research application.
| Application Type | Recommended Purity | Rationale |
|---|---|---|
| NMR, Crystallography | \ge 98\text{–}99% | Minimizes interference from structural variants |
| In vivo Studies, Bioassays | 95\text{–}98% | Reduces unintended biological effects |
| Screening Assays | 70\text{–}80% | Suitable for high-throughput exploratory work |
Molecular Identity Confirmation Using Mass Spectrometry
Mass Spectrometry confirms peptide identity by measuring the mass-to-charge ratio ($m/z$). This step is essential because HPLC purity alone cannot verify that the correct peptide was synthesized.
A peptide sample may appear highly pure chromatographically while still representing the wrong compound if synthesis errors occurred.
Monoisotopic Mass Versus Average Mass
For peptide characterization, monoisotopic mass is the preferred reference value. It is calculated using the most abundant isotopes such as ^{12}C, ^{1}H, and ^{14}N.
A high-quality report should provide monoisotopic mass measurements with precision better than \pm 1 Da. This accuracy is important because small modifications, including deamidation, produce minimal mass shifts of approximately +0.98 Da.
Failure to identify these modifications accurately can contribute to Biosimilar Comparability Failure. High-resolution systems such as Orbitrap and Q-TOF instruments provide the parts-per-million (ppm) accuracy necessary for reliable confirmation.
MS/MS Fragmentation and Sequence Mapping
Tandem Mass Spectrometry (MS/MS) strengthens identity confirmation by fragmenting the peptide backbone and generating characteristic b and y ion series.
This peptide mapping approach:
- Confirms amino acid sequence order
- Detects single-residue substitutions
- Identifies post-translational modifications
- Reveals unexpected structural changes
Even subtle sequence changes can be detected through shifts in fragmentation patterns.
Get the full picture of your peptide sequence: Comprehensive Peptide Mapping for Biosimilar Identity
Net Peptide Content (NPC) and Accurate Dosing
Net Peptide Content (NPC) measures the percentage of total sample weight attributable to peptide material, excluding water, salts, residual solvents, and counterions.
Because lyophilized peptides often contain significant non-peptidic material, failing to account for NPC can lead to inaccurate dosing and inconsistent experimental outcomes.
Calculating Actual Peptide Quantity
The true amount of target peptide depends on:
- Gross sample weight
- HPLC purity
- NPC value
For example:
10 mg×0.98×0.80=7.84 mg10\text{ mg} \times 0.98 \times 0.80 = 7.84\text{ mg}10 mg×0.98×0.80=7.84 mg
In this example, only 7.84 mg of the supplied material represents usable target peptide.
Ignoring this calculation during potency comparisons can increase the risk of Biosimilar Comparability Failure.
Common NPC Determination Methods
Amino Acid Analysis (AAA)
AAA involves complete peptide hydrolysis followed by amino acid quantification. It is widely considered the most accurate method for NPC determination because it directly measures amino acid content.
Nitrogen Analysis
Nitrogen analysis estimates peptide concentration based on total elemental nitrogen content. While useful, it is less specific because non-peptidic nitrogen sources may interfere with results.
Moisture and Counterion Analysis
Peptides are frequently isolated as salt forms to improve stability and solubility. Common counterions include:
- Trifluoroacetate (TFA)
- Acetate
- Hydrochloride (HCl)
Controlling residual moisture and counterion content is critical for long-term stability and lot consistency.
Karl Fischer Moisture Analysis
Karl Fischer titration is commonly used to determine residual water content.
Peptides are highly hygroscopic, and excessive moisture can promote hydrolytic degradation. Moisture levels above approximately $5\text{–}10%$ may negatively affect long-term stability studies.
Biological Impact of Counterions
Residual TFA may cause cytotoxic effects or interfere with biological assays. As a result, acetate or HCl salts are often preferred for clinical and in vivo applications.
A peptide datasheet should clearly report residual TFA levels, especially when TFA removal has been performed.
| Counterion | Common Use | Compatibility |
|---|---|---|
| TFA | Standard synthesis and purification | Potentially cytotoxic in some assays |
| Acetate | Ion-exchanged product | Preferred for biological applications |
| HCl | Stable salt form | Common in API formulations |
Residual Solvent Testing and ICH Q3C Compliance
Residual solvent analysis ensures that volatile chemicals used during synthesis and purification remain within acceptable toxicological limits defined by ICH Q3C guidelines.
Common solvents include:
- Acetonitrile
- Methanol
- Ethanol
- Acetone
Failure to monitor residual solvents can contribute to Biosimilar Comparability Failure during regulatory review.
ICH Q3C Solvent Categories
Class 1 Solvents
Known carcinogens that should be avoided entirely.
Class 2 Solvents
Toxic solvents requiring strict exposure limits.
Class 3 Solvents
Low-toxicity solvents generally acceptable below 5,000 ppm.
Gas Chromatography (GC) methods are commonly used for sensitive residual solvent analysis, often detecting trace levels below 10 ppm.
Aggregation Analysis and Orthogonal Testing
Aggregation refers to the formation of high-molecular-weight species such as dimers or polymers. These aggregates can compromise therapeutic safety and efficacy.
Aggregates are often more immunogenic than monomeric peptides and remain a major concern in biosimilar development.
Size-Exclusion Chromatography (SEC)
SEC separates molecules according to hydrodynamic size:
- Larger aggregates elute earlier
- Smaller molecules elute later
When combined with Multi-Angle Light Scattering (MALS), SEC can provide absolute molecular weight measurements without external calibration.
Importance of Orthogonal Techniques
Because some aggregates may evade detection by SEC alone, orthogonal methods such as Sedimentation Velocity Analytical Ultracentrifugation (SV-AUC) are frequently used for confirmation.
Regulatory agencies increasingly expect aggregation profiles to be validated using multiple independent analytical approaches.
Post-Translational Modifications and Structural Variability
Post-translational modifications (PTMs) add another layer of complexity to peptide characterization.
Common PTMs include:
- Glycosylation
- Oxidation
- Deamidation
- C-terminal lysine clipping
Even minor differences in PTM distribution may affect:
- Drug half-life
- Receptor binding
- Pharmacokinetics
- Immunogenicity
Identify and quantify molecular variations: Analyzing Post-Translational Modifications (PTMs) in Biosimilars
LC-MS/MS Characterization of PTMs
Advanced LC-MS/MS workflows enable detailed PTM mapping at multiple structural levels.
For example, deamidation converts asparagine into aspartic acid, altering molecular charge and potentially affecting biological function.
High-resolution peptide mapping can pinpoint modification sites and quantify their abundance with excellent precision.
Multi-Attribute Method (MAM)
The Multi-Attribute Method (MAM) allows simultaneous evaluation of:
- PTMs
- Aggregation
- Impurities
- Product variants
MAM is becoming increasingly important for real-time process monitoring and maintaining biosimilarity throughout manufacturing.
Dive deeper into glycan profiling: Detailed Glycosylation Analysis for Biosimilar Development
Why Biosimilar Comparability Failures Occur
Many biosimilar approval failures stem from deficiencies in Chemistry, Manufacturing, and Controls (CMC) documentation or inadequate analytical characterization.
Common Regulatory Deficiencies
Typical issues include:
- Incomplete impurity comparability data
- Poor analytical method validation
- Manufacturing inconsistencies
- Unstable quality profiles during shelf-life testing
Regulators expect manufacturers to demonstrate consistent control over every aspect of the molecular profile.
Real-World Examples
Several pegfilgrastim biosimilars have encountered approval delays due to pharmacokinetic comparability concerns and manufacturing deficiencies.
Similarly, some liraglutide-related submissions were rejected because regulators considered the fibrillation and structural characterization data insufficient.
These cases highlight the importance of evaluating the complete molecular profile rather than focusing solely on primary sequence identity.
Emerging Trends in Peptide Characterization (2025–2026)
AI and Digital Process Control
Automation and artificial intelligence are transforming peptide manufacturing and analytical workflows.
By 2026, Process Analytical Technology (PAT) systems are expected to become more widespread, enabling:
- Real-time monitoring
- Automated process adjustments
- Improved manufacturing consistency
AI-driven tools are also helping scientists interpret complex MS/MS datasets and predict biosimilarity outcomes more efficiently.
Regulatory Evolution
As large numbers of biologics approach patent expiration, regulatory agencies are adapting approval frameworks to handle increased biosimilar submissions.
Future regulatory models are expected to rely even more heavily on advanced analytical characterization while reducing dependence on extensive clinical trials.
This shift places greater emphasis on high-resolution structural data and comprehensive molecular profiling.
A Scientist’s Checklist for Reviewing Peptide Purity Reports
1. Identity and Sequence Verification
- Monoisotopic mass matches theoretical mass with ppm accuracy
- MS/MS fragmentation confirms amino acid sequence
- Deamidation and oxidation variants are evaluated
2. Chromatographic Purity
- HPLC/UPLC chromatogram is included
- Method details are clearly stated
- Peak integration excludes background noise
- No unexplained secondary peaks or major tailing observed
3. Quantitative Composition
- Net Peptide Content determined by AAA or nitrogen analysis
- Water content measured by Karl Fischer titration
- Counterion identity and concentration reported
- Overall mass balance approaches 100%
4. Impurity and Stability Assessment
- Truncated and deletion sequences identified
- Residual solvents comply with ICH Q3C limits
- Aggregation analyzed using SEC or orthogonal methods
- Endotoxin and sterility data available for in vivo applications
Conclusion
Avoiding Biosimilar Comparability Failure requires far more than simply achieving a high purity percentage. Comprehensive peptide characterization demands a detailed understanding of molecular identity, quantitative composition, impurity profiles, aggregation behavior, and post-translational modifications.
By carefully reviewing peptide purity reports using a structured scientific checklist, researchers can strengthen data reliability, improve regulatory readiness, and reduce the likelihood of downstream development failures.
As peptide therapeutics and biosimilars continue to evolve, advanced analytical technologies and digital manufacturing controls will play an increasingly central role in establishing the “totality of evidence” necessary for successful product development and regulatory approval.
Master the full spectrum of characterization: A Guide to Biosimilar Characterization Using Mass Spectrometry
For expert guidance on peptide characterization, method validation, and analytical compliance, contact the team directly through ResolveMass Contact Page
Frequently Asked Questions (FAQs)
Biosimilar comparability failure happens when a biosimilar peptide does not sufficiently match the original reference product in structure, function, or clinical performance. This mismatch can result from variations in impurity levels, aggregation, or missing amino acid sequences. Such differences may influence the peptide’s effectiveness, stability, or safety profile during research or therapeutic use.
A 99% HPLC purity result alone is not enough to fully validate a peptide sample. HPLC mainly measures the proportion of detectable peptide-related compounds but does not confirm the molecular identity. Additional testing, such as mass spectrometry and Net Peptide Content (NPC) analysis, is important for verifying composition and determining accurate dosing strength.
Some analytical reports include both crude purity and final purified purity values. Crude purity reflects the material before complete purification, while purified purity represents the finished batch after processing. Researchers should focus on the final analytical purity because it provides the most accurate indication of the peptide quality they actually received.
Monoisotopic mass is calculated using the most common isotope of each element found in the peptide molecule. Average mass, in contrast, considers the natural distribution of all isotopes and provides a weighted average value. Monoisotopic measurements are generally preferred for precise peptide identification, especially in mass spectrometry analysis.
Trifluoroacetic acid (TFA) is commonly used during peptide synthesis and purification, but residual amounts may interfere with biological experiments. In cell culture or animal studies, TFA can contribute to toxicity or unwanted inflammatory effects. Replacing it with more biocompatible counterions, such as acetate, helps improve experimental reliability and sample safety.
Excess moisture can reduce peptide stability by promoting hydrolysis, a process that gradually breaks peptide bonds. This degradation may lower product quality and shorten shelf life over time. Moisture testing methods like Karl Fischer titration help confirm that peptides are sufficiently dry for safe long-term storage, particularly under frozen conditions.
Deletion sequences are impurities formed when one or more amino acids are omitted during peptide synthesis. These incomplete sequences often appear as minor peaks close to the main product in HPLC chromatograms. In mass spectrometry data, they are identified by molecular weights that are lower than the expected peptide mass.
A supplier’s Certificate of Analysis (CoA) can provide useful preliminary quality information, but it may not always satisfy regulatory requirements. Many regulatory agencies prefer data generated by accredited third-party laboratories operating under GLP or GMP standards. Independent verification increases confidence in the accuracy, consistency, and reliability of the reported results.
Reference:
- European Medicines Agency. (2024). ICH Q3C (R9) residual solvents – Scientific guideline. EMA. EMA Guideline Page
- U.S. Food and Drug Administration. (2021). Q3C(R8) impurities: Guidance for residual solvents — Guidance for industry. U.S. Department of Health and Human Services.
FDA Guidance Document - Osterberg, R. E. (2007). Impurities: Residual solvents (ICH Q3C) [Presentation]. USP/PDA Joint Conference on Residual Solvents, Bethesda, MD, United States Pharmacopeia.
USP Presentation PDF