

Introduction
Forced Degradation Studies in CMC serve as the mechanistic engine of a defensible pharmaceutical impurity control strategy, linking intrinsic molecular reactivity directly to analytical method specificity, specification justification, and shelf-life risk mitigation. Rather than treating stress testing solely as a late-stage Phase 3 compliance exercise, structured degradation profiling generates the chemical, kinetic, and matrix-interaction intelligence needed to anticipate breakdown pathways before they trigger clinical holds, out-of-specification (OOS) laboratory investigations, or multi-cycle regulatory deficiencies. Across small molecules, peptides, and biologics, regulators evaluate whether every observed or potential degradant is traceable to a defined chemical mechanism, accurately resolved by orthogonal stability-indicating methods, and controlled within toxicology-justified limits.
Building an audit-ready control architecture requires moving beyond generic stress checklists toward risk-based experimentation anchored in evolving global standards. Under the current regulatory landscape—spanning Step 4 adoption of ICH Q14 and ICH Q2(R2) (November 2023; issued by FDA in March 2024), FDA’s Revision 2 nitrosamine framework (September 2024, with acceptable intake tables updated September 24, 2026), and the consolidated Step 2b ICH Q1 stability overhaul (April 2025, targeted in the February 2026 ICH work plan for Step 4 adoption in November 2026)—Chemistry, Manufacturing, and Controls (CMC) teams must unify synthetic process impurities, excipient-mediated incompatibilities, and storage degradants into one lifecycle dossier. Executed with rigorous mass balance accounting and high-resolution structural elucidation, stress data elevates Common Technical Document (CTD) Module 3 filings from reactive documentation into predictive Quality by Design (QbD) control frameworks.
For comprehensive support in developing integrated pharmaceutical CMC strategies, explore the available technical capabilities.
CMC Services
Share via:
Quick Summary:
- Forced degradation is a planning tool, not just a late-stage checkbox. Stress testing done early shows how a molecule breaks down, which shapes the analytical method, the specifications and the shelf-life strategy. It also helps avoid clinical holds, OOS investigations and repeated regulatory queries.
- It has to line up with the full ICH framework. That means Q1 (stability), Q2(R2) and Q14 (method validation and lifecycle), Q3A/Q3B (impurity thresholds) and M7 (mutagenic impurities). The draft consolidated ICH Q1 lets sponsors design their own stress conditions as long as they justify them scientifically.
- Aim for about 5–20% degradation. Going further creates secondary breakdown products that never form during real storage. For very stable APIs, the article suggests stopping once the energy applied exceeds what accelerated storage would supply, rather than forcing breakdown with harsh reagents. Avoid methanol as a co-solvent, because it can create artificial degradants.
- Drug product testing matters because excipients change the chemistry. Residual peroxides, reducing sugars and trace nitrites in excipients can drive oxidation, Maillard reactions and nitrosamine (NDSRI) formation. None of these show up when the API is tested alone.
- PDA peak purity alone doesn’t prove a method is stability-indicating. It can miss degradants with the same UV spectrum, ones with no UV signal, or ones that elute at the peak apex. Orthogonal detection (LC-MS, CAD, ELSD), different column selectivity and relative response factors (RRFs) close those gaps.
- Mass balance needs more than a 95–105% check. The article recommends calculating absolute and relative mass balance and applying RRF corrections. Low results usually point to volatile losses, degradants the method isn’t detecting, or sample prep problems.
- Findings must turn into limits and controls. Degradants are judged against dose-based ICH Q3A/Q3B thresholds, and mutagenic ones against the M7 limit (1.5 µg/day) or nitrosamine-specific limits. Anything above the identification threshold is characterized by LC-HRMS and NMR. The results then feed into process, formulation, packaging and specification controls across the product’s lifecycle.
Regulatory Alignment for Forced Degradation Studies in CMC
Forced Degradation Studies in CMC must align with an interconnected regulatory framework spanning the ICH Q1 stability standards, ICH Q14 and ICH Q2(R2) analytical lifecycle requirements, ICH Q3A(R2)/Q3B(R2) dose-based thresholds, and ICH M7(R2) mutagenic controls. Regulatory reviewers examine stress testing not merely to confirm chromatographic peak separation, but to verify that stability-indicating Critical Quality Attributes (CQAs), primary packaging selections, and shelf-life acceptance criteria account for every plausible degradation route.
Integrating Forced Degradation Studies in CMC with ICH Q1, Q2(R2), and Q14
Aligning Forced Degradation Studies in CMC with ICH Q14 and ICH Q2(R2) connects analytical procedure design directly to formal validation and post-approval lifecycle management. Adopted at ICH Step 4 in November 2023 and finalized by FDA in March 2024, ICH Q14 introduces the Analytical Target Profile (ATP) to define a method’s intended purpose and anticipated performance criteria—such as specificity, accuracy, and precision across a reportable range—prior to development. During Q14 enhanced development, evaluating stressed mixtures across multivariate parameter ranges (including buffer pH, column temperature, and detection conditions) informs robustness boundaries, system suitability tests (SSTs), and Established Conditions (ECs). Under ICH Q2(R2) Section 2.4, these stressed samples—paired with impurity-spiked and aged product lots—provide formal validation evidence of stability-indicating properties.
For analytical procedures that require development and validation throughout the drug development lifecycle, consider specialized method development support.
Analytical Method Development for IND and NDA
In parallel, the draft consolidated ICH Q1 guideline—endorsed at Step 2b on April 11, 2025, and targeted in the February 2026 ICH Expert Working Group work plan for Step 4 adoption in November 2026—merges legacy guidelines Q1A–Q1F and Q5C into a single risk-based framework covering chemical drugs and biologics (with industry analyses of the draft also noting vaccines and advanced therapy medicinal products). Under the Step 2b draft, sponsors retain experimental discretion over stress design provided exposure levels are scientifically justified, and are expected to link developmental forced degradation findings to stability-indicating CQAs, packaging protection, and any product labeling claims. Industry commentary from stability-modeling vendors and GMP analysts further highlights that the consolidated ICH Q1 framework formalizes predictive stability modeling and lifecycle integration aligned with ICH Q12.
Avoiding Common FDA CMC Deficiencies in NDA and ANDA Filings
Regulatory queries and multi-cycle Abbreviated New Drug Application (ANDA) delays frequently arise from incomplete stress matrices, uncontrolled over-degradation, or poorly documented experimental execution rather than inherent molecule instability. As detailed in FDA scientific perspectives on ANDAs, reviewers routinely cite deficiencies when stress protocols produce excessive secondary degradation or fail to justify minimal breakdown in stable APIs, omit required white-light and UV photostability parameters under ICH Q1B, or neglect thermal/humidity testing in 10 °C increments above accelerated storage with ≥75% relative humidity. Industry GMP audit analyses similarly flag inadequate real-time documentation of reagent molarity, temperature, pH, exposure duration, and sample neutralization, alongside unresolved mass balance gaps.
A nuanced regulatory rule governs finished dosage forms under FDA’s cGMP laboratory control Q&A guidance. FDA clarifies that drug product forced degradation testing is not strictly mandatory in every case if degradation routes and analytical method suitability can be conclusively established through drug substance stress data, authentic impurity and degradant reference standards, and accelerated and long-term stability data on both the API and finished product—provided the rationale for both study scope and stability-indicating conclusions is fully documented. In practice, however, waiving drug product stress testing introduces substantial review and technical risk whenever formulation excipients contribute residual peroxides, reducing sugars, or trace nitrites that catalyze breakdown pathways absent in neat API.
Address potential regulatory gaps early with focused technical and documentation support for pharmaceutical submissions.
CMC Deficiencies in IND and NDA
Stress Condition Design: Generating Predictive Degradation Without Artifacts
Effective stress testing targets 5–20% active ingredient degradation—or delivers thermal and oxidative energy exceeding accelerated storage (40 °C for 6 months)—to generate storage-relevant primary degradants without triggering secondary decomposition cascades. Pushing degradation past roughly 20–30% degrades primary products into secondary and tertiary artifacts that rarely form under labeled storage, distorting degradation kinetics and complicating mass balance interpretation. Conversely, terminating at <5% loss without kinetic energy justification fails to prove that an analytical method can track meaningful potency decline or resolve emerging impurities.
For chemically refractory APIs that resist breakdown, foundational industry best practices by Reynolds et al. and FDA ANDA reviews recommend terminating stress exposure once applied energy exceeds accelerated storage conditions rather than forcing destruction with extreme reagents. As modeled by Reynolds et al. assuming an activation energy Ea ≈ 12 kcal/mol, thermal exposure at 80 °C for 12 days supplies kinetic energy equivalent to 6 months at 40 °C. Drawing multi-timepoint aliquots (such as Days 1, 3, 5, and 7) enables kinetic trending to separate authentic primary degradants from downstream secondary reactions.
For scientifically justified stability assessment and shelf-life evaluation, explore dedicated pharmaceutical stability study capabilities.
Stability Studies in CMC
| Stress Modality | Drug Substance (DS) Design | Drug Product (DP) & Matrix Controls | Biologics / Biosimilars Adaptation | Key Pathway & Artifact Controls |
|---|---|---|---|---|
| Acid / Base Hydrolysis | 0.01–1.0 M HCl or NaOH/KOH/LiOH at ambient to 60–80 °C; neutralize prior to analysis. | Evaluate with matched placebo controls and buffer pH 2, 4, 6, 8 where relevant. | Acidic and alkaline pH shifts monitoring denaturation, fragmentation, and deamidation. | Titrate down to 0.01 N acid or lower temperature if rapid >20% loss occurs; avoid methanol in carboxylic acid, amide, arylamide, or hydroxyl APIs. |
| Peroxide Oxidation | 0.3–3% H2O2 (up to 30% for refractory APIs) at ambient to 40 °C in dark. | Include peroxide-spiked placebo to simulate residual excipient peroxides. | H2O2 or oxygen exposure probing oxidation of susceptible residues such as methionine. | Conduct in dark to isolate oxidative pathways from photolysis; include peroxide reagent controls. |
| Radical / Metal Oxidation | AIBN (organic-soluble), ACVA, or VA-044 (40–60 °C), pressurized/bubbled O2, or Fe3+/Cu2+ ions. | Include initiator controls and screen drug product autoxidation and trace-metal catalysis risks. | Oxygen exposure screening oxidative susceptibility alongside orthogonal LC-MS mapping. | Models free-radical autoxidation pathways and realistic oxygen reactivity when H2O2 is unsuitable. |
| Thermal & Humidity | Dry heat in 10 °C steps above 40 °C (50–80 °C) and ≥75–90% RH open-dish. | Test both exposed and in primary packaging; monitor physical state and moisture uptake. | Controlled thermal variation monitoring protein aggregation, fragmentation, and immunogenicity risk. | Avoid melting the API or sample matrix (literature notes testing below melting point) to prevent physical artifacts. |
| Photostability (ICH Q1B) | ≥1.2 million lux hours visible light plus ≥200 W·h/m2 UV energy with temperature control. | Sequential exposure: unwrapped to primary pack to secondary pack (parallel permitted for biologics). | Parallel light stress evaluating aggregation, oxidation, clarity, and color. | Control chamber temperature; avoid methanol co-solvents due to photo-induced methoxy radical artifacts. |
| Mechanical / Physical | Polymorph and physical form stability monitoring across stress exposure. | Freeze-thaw cycling and handling stress for sensitive dosage forms. | Mechanical agitation/shear and freeze-thaw cycles targeting particle formation and aggregation. | Monitor physical state, clarity, color, particle size, and XRPD/DSC/CD where relevant. |
Drug Substance vs. Drug Product Matrix Effects and Excipient Interactions
Drug product stress protocols cannot simply copy drug substance stress designs because excipient dilution, solid-state microenvironments, and trace reactive impurities reshape degradation pathways. Residual peroxides originating in excipients or packaging components drive oxidative breakdown, while reducing sugar impurities in microcrystalline cellulose (MCC) can undergo Maillard condensation with amine or amino acid moieties—documented in peer-reviewed studies of an MCC/L-phenylalanine drug complex to cause both discoloration and reactive oxidative species that further oxidize the active molecule. Likewise, trace nitrite contaminants in excipients such as MCC react with vulnerable secondary or tertiary amines under low-pH microenvironments to generate Nitrosamine Drug Substance-Related Impurities (NDSRIs), and nitrocellulose packaging can react with amines in printing ink during heat sealing.
Solvent and co-solvent selection during sample preparation is an equally common source of non-representative artifacts. When poor aqueous solubility requires an organic co-solvent, acetonitrile is generally preferred over methanol. Methanol can react with carboxylic acids, amides, arylamides, or hydroxyl functional groups during hydrolytic heating and generates methoxy radicals under ICH Q1B light exposure, creating artificial adducts that never form in solid dosage forms. To focus bench experiments, CMC teams increasingly pair chemical expertise with in silico degradation platforms (such as Zeneth, as described by Lhasa Limited) linked to excipient impurity databases like the Nitrites in Excipients consortium. While computational tools intentionally over-generate theoretical reactions and never substitute for wet-lab testing, they rapidly prioritize high-risk API-excipient pathways before formal stress matrices begin.
Assess potential packaging-related contamination and material interactions through specialized extractables and leachables evaluation.
Extractables and Leachables in CMC
Proving Stability-Indicating Specificity Beyond Single-Detector Peak Purity
Demonstrating stability-indicating capability under ICH Q2(R2) requires showing that the active pharmaceutical ingredient and all specified degradants are chromatographically resolved—commonly targeting baseline resolution Rs > 1.5 in pharmaceutical validation practice—without co-eluting interferences, an objective that single-wavelength UV or standalone Photodiode Array (PDA) peak purity cannot reliably guarantee. Modern control strategies combine multi-modal detectors with orthogonal stationary-phase selectivity so that hidden, isobaric, or UV-silent degradants cannot evade routine release and stability monitoring.
Why Photodiode Array Peak Purity Fails as Standalone Proof
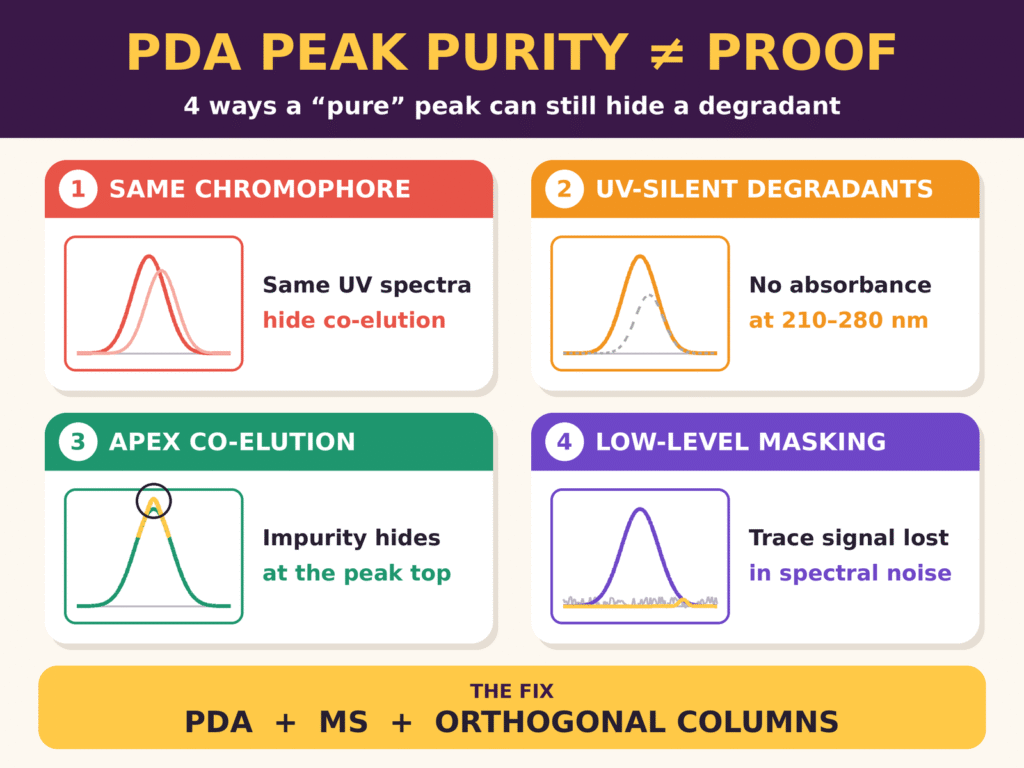
PDA spectral homogeneity algorithms—evaluating whether the purity angle remains below the purity threshold or whether the purity factor reaches ≥990—verify only that normalized UV spectra across a peak’s upslope, apex, and downslope are mathematically consistent, rather than proving chemical homogeneity. Industry evaluations published in LCGC International and practitioner analyses in Separation Science highlight four recurring failure modes where PDA peak purity generates false confidence or false alarms:
- Identical or overlapping chromophores: Degradants or structurally related impurities that retain the parent molecule’s intact UV chromophore yield indistinguishable spectra even during complete co-elution, as demonstrated in Waters orthogonal detection studies where related compounds exhibit identical UV spectra despite distinct molecular masses.
- UV-silent or weak-chromophore degradants: Non-aromatic compounds (such as memantine) and small aliphatic cleavage products—including acetic acid, formic acid, formaldehyde, and methanol—lack significant absorbance in the 210–280 nm range, making them invisible beneath an active UV peak.
- Apex co-elution: When an impurity elutes near the apex of the parent peak rather than on a leading or trailing shoulder, spectral differences across the peak profile are masked.
- Low-level masking and scan-range noise: Trace co-eluting impurities with poor UV response fall beneath PDA spectral noise thresholds, whereas practitioner troubleshooting reported in Separation Science notes that widening scan ranges down to 190 nm introduces low-wavelength mobile-phase noise that can falsely flag pure peaks as impure.
Orthogonal Detection, Selectivity Switching, and Relative Response Factors
Resolving PDA blind spots requires orthogonal verification across both detection physics and chromatographic selectivity. Pairing PDA inline with mass spectrometry—comparing precursor ions, fragment ions, and adducts at the peak front, apex, and tail across Total Ion Chromatograms (TIC) and Extracted Ion Chromatograms (EIC)—exposes spectrally identical co-eluting impurities by mass shift. Conversely, PDA provides critical complementarity to standalone MS because single-mass detectors cannot separate isobaric degradants (compounds sharing identical nominal mass, such as MW 428.5 in Waters ARB studies) or detect poorly ionizing species. For aliphatic, volatile, or non-ionizable cleavage products, universal detectors such as Charged Aerosol Detection (CAD), Evaporative Light Scattering Detection (ELSD), Refractive Index (RI), ion chromatography, or headspace GC-MS close the analytical gap.
On the separation axis, when capacity factors (1 < k’ < 5) and column plate counts are optimized yet co-elution persists, analysts must modify selectivity (α) by screening alternative stationary phases—switching from C18 to biphenyl, amide, C12, or AR columns—or isolating the parent peak for heart-cutting 2D-LC analysis under orthogonal mobile-phase conditions. Equally essential for quantitative accuracy is determining Relative Response Factors (RRFs) rather than assuming a 1:1 UV response against the parent drug. Calculated as the ratio of the degradation product’s calibration curve slope to the API’s slope, RRF correction prevents severe mass under- or over-estimation whenever chemical breakdown alters molar absorptivity.
Relative Response Factor formula:
RRF = SDP / SAPI
For complex degradation profiles requiring improved selectivity and detector compatibility, consider customized analytical procedure development.
Custom Analytical Method Development for Drug Discovery
| Hidden Impurity Challenge | Primary Analytical Blind Spot | Recommended Orthogonal Technique | CMC Control Benefit |
|---|---|---|---|
| Degradant with identical UV chromophore | PDA purity angle stays below threshold despite co-elution. | Inline LC-QDa / LC-HRMS EIC extraction across peak front, apex, and tail. | Eliminates hidden peak inflation in assay and exposes co-eluting related substances. |
| Isobaric degradants or stereoisomers | Single-MS EIC shows unified m/z trace. | UV-PDA spectral overlay paired with biphenyl, amide, or chiral/2D-LC column switching. | Separates structural isomers and verifies stereochemical stability. |
| Aliphatic / non-chromophoric cleavage | Invisible under standard 210–280 nm UV detection. | CAD, ELSD, RI, ion chromatography, or headspace GC-MS. | Captures formaldehyde, formic acid, acetic acid, and small polar degradants. |
| Strongly polar or hydrophobic aggregates | Elutes unretained at solvent void or remains bound on C18. | Extended gradient (e.g., +10 minutes), ion chromatography, or orthogonal particle-size and native MS profiling (biologics). | Prevents missed dimers, polymers, and polar breakdown products. |
| Trace mutagenic nitrosamines / NDSRIs | Below routine RP-HPLC-PDA LOD (0.01–0.05%) and masked by matrix. | Triple-quadrupole LC-MS/MS (MRM mode) or LC-HRMS down to low pg/mL. | Supports sub-ppm verification against CPCA and compound-specific AI limits. |
Closing the Mass Balance Deficit in Forced Degradation Studies in CMC
Mass balance verifies conservation of mass in Forced Degradation Studies in CMC by confirming that remaining parent drug plus all measured degradation products equals the initial API content, yet evaluating unadjusted 95–105% arithmetic windows alone frequently misleads analysts. Although ICH Q1A(R2) establishes no numeric acceptance limit, regulators routinely scrutinize unexplained mass balance shortfalls—whether against broad 95–105% benchmarks or tighter 97–103% internal targets—as evidence of co-eluting peaks, volatile loss, or unretained degradants.
Rigorous mass balance interpretation tracks three metrics summarized in stability conference proceedings and Baertschi stress-testing literature:
Absolute Mass Balance (AMB):
AMB (%) = [(Astressed + Σ DRRF-corrected) / Ainitial] × 100
Summed Mass Balance (SMB):
SMB (%) = Astressed (%) + Σ DRRF-corrected (%)
Relative Mass Balance (RMB):
RMB (%) = [Σ Dformed / (Ainitial − Astressed)] × 100
In these expressions, Ainitial is the unstressed or initial control API assay, Astressed is the remaining API assay after stress exposure, and Dformed represents the RRF-corrected degradation products generated.
Evaluating Absolute Mass Balance (AMB) without calculating Relative Mass Balance (RMB) or accounting for method precision (where assay repeatability criteria are commonly ≤2.0% RSD) obscures true analytical gaps. For illustration, if a sample loses 5% API assay (95% remaining) while yielding only 1% measurable degradants, AMB equals 96%—passing a conventional 95–105% screen—yet RMB is only 20% (1% / 5%), leaving 80% of the degraded mass unaccounted for. Conversely, as noted in a technical review by Covasyn, fixed arithmetic limits lack uncertainty propagation: a 94.9% total on a variable matrix does not automatically prove analytical failure, nor does 95.1% validate a method if RRF corrections were skipped. In an illustrative acid-stress scenario modeled by Covasyn, applying authentic-standard RRF corrections and integrating one sub-threshold peak elevated calculated mass balance from an uncorrected 91.0% to 97.2% without altering chromatographic conditions.
A structured impurity profiling approach can help identify unexplained degradation products and strengthen analytical mass balance assessments.
Impurity Profiling in CMC
| Observed Mass Balance Anomaly | Mechanistic Root Cause | Confirmatory Diagnostic Experiment | Corrective Control Action |
|---|---|---|---|
| AMB <95% or low RMB | Degradants possess RRF <1 at UV detection wavelength. | Determine authentic-standard RRF or evaluate response using CAD/ELSD/MS. | Apply experimentally validated RRF corrections using authentic standards. |
| AMB <95% (thermal/acid/base) | Volatile species (CO2, acetic acid, formaldehyde, formic acid, methanol) escaping prep or hot autosampler. | Analyze sealed samples via headspace GC-MS or GC-FID. | Minimize evaporative losses during sample prep and autosampler holding. |
| AMB <95% (oxidative/hydrolytic) | Non-chromophoric fragments or dimer/polymer formation consuming 2 moles API. | Extend chromatographic gradient (e.g., by 10 minutes) and screen void/late zones with CAD/ELSD/IC. | Extend elution window or deploy orthogonal universal/ion detection. |
| AMB <95% (sample workup) | Precipitation of poorly soluble oxidation products or adsorption to glass, filter membranes, or PEEK. | Compare centrifuged versus filtered aliquots and re-test after changing diluent solvent strength. | Optimize extraction solvent strength and validate sample recovery. |
| AMB >105% | Degradant RRF >1, detector non-linearity, or co-eluting excipient/artifact. | Verify linearity across 80–120% assay range and inject stressed placebo blank. | Apply RRF >1 correction, dilute within linear range, and resolve co-elution. |
Translating Degradation Data into Thresholds, Structural Elucidation, and Specifications
Forced degradation findings carry regulatory authority only when translated into dose-aligned safety thresholds, confirmed chemical structures, and enforceable process, formulation, and packaging specifications. Every degradant observed during formal stability or shelf-life-relevant stress conditions must be evaluated against ICH Q3A(R2), ICH Q3B(R2), and ICH M7(R2) thresholds to establish reporting, identification, toxicological qualification, or trace mutagenic control requirements.
Applying ICH Q3A(R2), Q3B(R2), and ICH M7(R2) / CPCA Thresholds
Impurity action thresholds under ICH Q3A(R2) (drug substances) and ICH Q3B(R2) (drug products) scale inversely with Maximum Daily Dose (MDD) and enforce a strict “whichever is lower” rule comparing percentage concentration against absolute Total Daily Intake (TDI). For a drug substance at 0.5 g/day (≤2 g/day tier), ICH Q3A(R2) sets reporting at 0.05%, identification at 0.10%, and qualification at 0.15%, with reporting tightening to 0.03% above 2 g/day. Under ICH Q3B(R2) for finished products—where full four-tier breakdowns in regulatory training references align with official EMA Q3B(R2) examples—reporting limits sit higher (0.1% for ≤1 g/day; 0.05% for >1 g/day) to accommodate complex product matrices, while identification and qualification limits follow strict MDD/TDI caps. Calculating both metrics prevents threshold errors: at an MDD of 50 mg/day under Q3B(R2) (matching official EMA Q3B(R2) Example 1), 0.2% equals 100 µg/day (below the 2 mg identification TDI cap, so 0.2% governs), whereas 0.5% equals 250 µg/day—exceeding the 200 µg/day qualification TDI limit—making 0.4% the effective qualification ceiling. Similarly, at 5 mg/day, the 20 µg/day identification TDI cap reduces the effective identification threshold from 0.5% to 0.4%.
When any observed or theoretical degradant carries structural alerts for DNA reactivity, ICH M7(R2) supersedes Q3A/Q3B thresholds entirely, imposing a default Threshold of Toxicological Concern (TTC) of 1.5 µg/day for lifetime exposure (with Less-Than-Lifetime [LTL] adjustments where justified). Within ICH M7(R2), N-nitrosamines occupy the “cohort of concern,” requiring compound-specific Acceptable Intake (AI) limits derived from carcinogenicity data, surrogate read-across, or FDA’s Carcinogenic Potency Categorization Approach (CPCA)—where NDSRI recommended AI limits extend up to 1,500 ng/day in Categories 4 and 5, alongside a 26.5 ng/day interim AI recommended by FDA for several small-molecule nitrosamines. Notably, FDA’s CDER nitrosamine reporting recommendations (with acceptable intake tables updated September 24, 2026) explicitly advise sponsors to determine whether NDSRIs can form under targeted forced degradation alongside confirmatory batch testing.
An effective impurity control strategy helps translate degradation findings and toxicological assessments into scientifically justified acceptance limits.
Impurity Control Strategy in CMC
| Regulatory Framework | Scope & Trigger Mechanism | Dose / Structural Tier | Action Limit (Whichever Is Lower) | Required CMC Output |
|---|---|---|---|---|
| ICH Q3A(R2) | Process impurities and DS degradants in API. | MDD ≤2 g/day (e.g., 500 mg/day example). | Reporting: 0.05% / Identification: 0.10% / Qualification: 0.15%. | Validated LOQ ≤0.05%; structural ID and safety justification above thresholds. |
| ICH Q3B(R2) Reporting | Degradation products in finished DP. | MDD ≤1 g/day vs. >1 g/day. | ≤1 g/day: 0.1% / >1 g/day: 0.05%. | All degradants > reporting threshold integrated and summed in total degradants. |
| ICH Q3B(R2) Identification | Structurally unknown degradants in DP. | <1 mg / 1–10 mg / >10 mg–2 g / >2 g/day. | 1.0% (5 µg) / 0.5% (20 µg) / 0.2% (2 mg) / 0.10%. | Full molecular structure via LC-HRMS, MS/MS, and NMR. |
| ICH Q3B(R2) Qualification | Biological safety of DP degradants. | <10 mg / 10–100 mg / >100 mg–2 g / >2 g/day. | 1.0% (50 µg) / 0.5% (200 µg) / 0.2% (3 mg) / 0.15%. | Tox/genotoxicity bridging, literature rationale, or RLD level matching (ANDA). |
| ICH M7(R2) | DNA-reactive mutagenic impurities & degradants. | Non-cohort-of-concern mutagens (lifetime). | 1.5 µg/day TTC (sub-ppm based on MDD). | Dual (Q)SAR (expert rule-based + statistical), purge factor, or Ames clearance. |
| FDA Nitrosamine / NDSRI (2024–2026) | Cohort-of-concern N-nitroso API/degradant derivatives. | CPCA Categories 1–5 & compound-specific limits. | Compound-specific (e.g., 26.5 ng/day interim small-molecule; 1,500 ng/day Cat. 4/5). | Targeted forced degradation for NDSRI formation, enhanced Ames, LC-MS/MS control. |
Structural Elucidation and Lifecycle Control Strategy Implementation
When forced degradation or batch testing reveals impurities above identification thresholds (for example, an unidentified impurity detected at 0.24% above a 0.2% identification threshold), structural elucidation proceeds through a tiered analytical cascade. Liquid chromatography coupled to quadrupole time-of-flight high-resolution mass spectrometry (LC-QTOF-HRMS) delivers exact mass measurements—achieving <2 ppm mass error in published analytical workflows—to assign molecular formulas and diagnose transformations including +16 Da oxidation or N-oxide formation, hydrolytic cleavage of moisture-sensitive groups, or thermal rearrangement and cyclization, while MS/MS fragmentation maps substitution sites. Where positional isomerism remains ambiguous, preparative HPLC isolates purified fractions for 1D and 2D high-field Nuclear Magnetic Resonance (NMR) confirmation.
Real-world CMC execution illustrates how structural elucidation reshapes formulation and regulatory outcomes. In an impurity characterization study of Nelarabine by ResolveMass Laboratories Inc., combining C18 LC-MS, HRMS, preparative HPLC, and NMR elucidated nine previously unreported degradants: isolating two major hydrolytic impurities (DP-1 and DP-2) for full NMR confirmation—identifying arabinose cleavage yielding the 6-methoxy-9H-purin-2-amine moiety (m/z 166.072) and alkali-sensitive demethylation—while assigning seven oxidative products via HRMS, directly guiding formulators away from high-pH excipients and oxidation triggers. In an IND-enabling virtual biotech case study reported by ResolveMass Laboratories, compiling stress-testing data with a 97.1–100.8% mass balance into CTD Sections 3.2.S and 3.2.P alongside batch impurity tracking supported 30-day FDA IND clearance with zero clinical holds or CMC queries.
Review an example of how analytical findings and CMC documentation can be integrated into an IND submission.
IND CMC Case Study
Embedding forced degradation intelligence into a commercial Impurity Control Strategy requires systematic execution across four operational pillars:
- Risk-Tiered Impurity Classification: Rank every identified process impurity and degradant into high-risk (potential mutagenic impurities, NDSRIs, and late-stage degradants), medium-risk (known impurities with proven purge), or low-risk (early-stage species purged downstream).
- Process and Formulation Engineering Controls: Tighten reaction stoichiometry, temperature, and pH limits through In-Process Controls (IPCs); select low-nitrite excipient grades (such as low-nitrite MCC) and excipients controlled for reducing sugars or residual peroxides; and qualify primary/secondary packaging via sequential ICH Q1B photostability testing.
- Data-Driven Specification Justification: Anchor impurity limits in toxicological qualification margins alongside batch capability—typically six to ten representative or commercial-scale batches—as illustrated in a ResolveMass NDA case example where Impurity X was accepted at 0.15% based on clean toxicology and consistent batch history below 0.10%. For ANDAs, qualify degradants against Reference Listed Drug (RLD) levels, significant metabolite status, scientific literature, or toxicity screens per FDA guidance.
- Lifecycle Method Governance: Validate ICH Q2(R2) methods with LOQs at or below reporting thresholds (≤0.05% for API; ≤0.1% for DP), analyze stressed samples at both sending and receiving laboratories during analytical method transfers, and maintain ongoing output monitoring under ICH Q14 and Q12.
Conclusion
Executing Forced Degradation Studies in CMC as a predictive, orthogonal discipline rather than a late-stage formality allows pharmaceutical sponsors to isolate genuine chemical and matrix liabilities early, confirm method specificity beyond single-detector limits, and build audit-proof specifications across CTD Module 3. By integrating kinetic-energy-justified stress matrices and RRF-corrected mass balance diagnostics with ICH Q14/Q2(R2) method lifecycles, ICH Q3A/Q3B thresholds, and targeted NDSRI risk evaluations, development teams eliminate analytical blind spots that delay IND clearances, NDA approvals, and ANDA review cycles.
Strengthen the regulatory presentation of forced degradation findings with structured CMC documentation and submission support.
Regulatory CMC Writing Services
Partnering with an accredited analytical laboratory ensures these specialized workflows translate seamlessly into regulatory-ready evidence. Operating under an ISO 9001:2015-certified Quality Management System alongside Health Canada Drug Establishment Licence 3-002945-A and US FDA Registration 3042696771, ResolveMass Laboratories Inc. pairs high-resolution LC-MS/MS, QTOF-HRMS, preparative HPLC, and high-field NMR expertise to design compliant forced degradation programs, resolve mass balance deficits, and characterize unknown degradants across small molecules and biologics. To discuss a customized stability-indicating method or impurity control strategy for your CMC program, connect with our scientific team via our Contact Us page.
Frequently Asked Questions
No. Finished drug product stress testing may not always be required if drug substance degradation studies, reference standards, and formal stability data adequately establish degradation pathways and analytical method suitability. However, sponsors must provide a documented scientific justification for omitting these studies. Testing the finished formulation with matched placebos is advisable when excipients may contribute to additional degradation reactions.
PDA peak purity assessment evaluates UV spectral consistency across a chromatographic peak, but it cannot reliably detect every co-eluting impurity. Degradants with similar chromophores, UV-inactive compounds, and species hidden beneath the main peak may remain undetected. Additional techniques, such as LC-MS/HRMS, CAD, ELSD, or alternative chromatographic selectivity, provide stronger evidence of analytical specificity.
A mass balance below 95% may indicate undetected degradation products, differences in detector response, or sample losses during preparation and analysis. Analysts should evaluate Relative Response Factors (RRFs), investigate volatile compounds using headspace GC-MS, and screen non-chromophoric species through CAD or ion chromatography. They should also examine possible precipitation, adsorption, and strongly retained degradation products to identify the source of the discrepancy.
Absolute Mass Balance (AMB) compares the remaining API assay and corrected degradation products with the initial API assay. Relative Mass Balance (RMB), in contrast, compares the amount of degradation products detected with the amount of API lost during stress testing. Using both calculations provides a clearer assessment of degradation recovery, particularly when the overall API loss is relatively small.
The consolidated ICH Q1 initiative brings several existing stability guidelines into a unified framework covering pharmaceutical and biological products. Its lifecycle-based approach emphasizes scientifically justified stability strategies and stronger connections between development studies, stability-indicating quality attributes, packaging, and product labeling. It also supports greater consideration of predictive modeling and lifecycle management principles when designing stability programs.
ICH Q14 provides a science- and risk-based framework for developing analytical procedures, including the Analytical Target Profile (ATP), robustness assessment, and evaluation of operating ranges. ICH Q2(R2) builds on this development work by establishing validation requirements for analytical procedures. Forced degradation samples help demonstrate that an analytical method can distinguish the API from its degradation products and provide reliable results under defined validation conditions.
Hydrogen peroxide is commonly used to investigate oxidative degradation, particularly reactions associated with peroxide-containing excipients. However, it may not adequately represent free-radical autoxidation or oxidation promoted by trace metals. In such cases, radical initiators such as AIBN, ACVA, or VA-044 may be considered alongside controlled oxygen exposure and transition metal ions to investigate alternative oxidative pathways.
Yes. Forced degradation studies can help determine whether Nitrosamine Drug Substance-Related Impurities (NDSRIs) may form under relevant stress conditions. APIs or degradation products containing secondary or tertiary amine groups may react with nitrites originating from excipients or packaging materials. Targeted stress testing, combined with suitable LC-MS/MS methods, helps evaluate potential NDSRI formation and determine whether further risk assessment or control measures are necessary.
ICH Q3A(R2) and ICH Q3B(R2) establish thresholds for reporting, identifying, and qualifying impurities in drug substances and drug products, respectively. These limits depend on factors such as the Maximum Daily Dose (MDD) and the amount of impurity present. Degradation products exceeding the applicable identification threshold generally require structural characterization, while those above the qualification threshold need an appropriate safety justification. Additional requirements may apply when mutagenic impurities are subject to ICH M7(R2).
Reference:
- International Council for Harmonisation (ICH). (2025, April 11). Draft ICH Q1 Guideline on Stability Testing of Drug Substances and Drug Products (Step 2b) (
EMA/CHMP/ICH/130561/2025), EMA Scientific Guideline Portal, and ICH Q1 EWG Work Plan (February 11, 2026). https://www.ema.europa.eu/en/documents/scientific-guideline/draft-ich-q1-guideline-stability-testing-drug-substances-drug-products-step-2b_en.pdf
; https://www.ema.europa.eu/en/scientific-guidelines/ich-q1-guideline-stability-testing-drug-substances-drug-products
; https://database.ich.org/sites/default/files/ICH52_Q1_EWG_WorkPlan_2026_0318.pdf - U.S. Food and Drug Administration (FDA) / ICH. (2024, March). Q14 Analytical Procedure Development: Guidance for Industry (ICH Step 4, November 2023) and Q2/Q14 Step 4 Presentation. https://www.fda.gov/media/161202/download
; https://database.ich.org/sites/default/files/Q2_Q14%20ICH_Step_4_Presentation_2023_1106_0.pdf - U.S. Food and Drug Administration (FDA) / ICH. (2024, March). Q2(R2) Validation of Analytical Procedures: Guidance for Industry (ICH Step 4, November 2023) and Q14/Q2(R2) Overview. https://www.fda.gov/media/161201/download
; https://www.fda.gov/media/165164/download - International Council for Harmonisation (ICH). ICH Q3A(R2): Impurities in New Drug Substances. https://database.ich.org/sites/default/files/Q3A%28R2%29%20Guideline.pdf
- European Medicines Agency (EMA) / ICH. ICH Q3B(R2): Impurities in New Drug Products. https://www.ema.europa.eu/en/documents/scientific-guideline/ich-q-3-b-r2-impurities-new-drug-products-step-5_en.pdf
- U.S. Food and Drug Administration (FDA). (2024, September; updated 2026, September 24). Control of Nitrosamine Impurities in Human Drugs (Revision 2) and CDER Nitrosamine Impurity Acceptable Intake Limits. https://www.fda.gov/media/141720/download
; https://www.fda.gov/regulatory-information/search-fda-guidance-documents/cder-nitrosamine-impurity-acceptable-intake-limits - U.S. Food and Drug Administration (FDA). ANDAs: Impurities in Drug Products and Questions and Answers on Current Good Manufacturing Practice Requirements, Laboratory Controls. https://www.fda.gov/files/drugs/published/ANDAs–Impurities-in-Drug-Products.pdf
; https://www.fda.gov/drugs/guidances-drugs/questions-and-answers-current-good-manufacturing-practice-requirements-laboratory-controls
; http://www.triphasepharmasolutions.com/Resources/Guidances%20(Drugs)%20%20Forced%20Degradation%20Questions%20and%20Answers%20on%20Current%20Good%20Manufacturing%20Prac.pdf
Get In Touch With Us
About The Author