

Introduction
FTIR and Raman spectroscopy for peptide secondary structure provide label-free methods for evaluating molecular conformation when far-ultraviolet circular dichroism (far-UV CD) becomes unreliable because of excipient UV absorbance, light scattering, concentration limitations, or ambiguity in β-sheet spectral interpretation. Although far-UV CD remains a convenient initial screening technique for soluble polypeptides in dilute phosphate buffers, its performance can deteriorate when examining multi-dose parenteral drug products, highly concentrated self-associating peptides, lipid-reconstituted sequences, and insoluble aggregates.
Unlike CD, which measures chiral electronic transitions, Fourier transform infrared (FTIR) and Raman spectroscopy investigate vibrational transitions involving peptide backbone and side-chain groups. This difference allows both techniques to overcome many UV transparency limitations while providing complementary information about hydrogen-bonding geometry, parallel and antiparallel strand arrangements, and local dihedral torsion angles.
This analytical complementarity is particularly important in peptide drug development because of its regulatory implications. Following the U.S. Food and Drug Administration (FDA) July 2026 release of 17 revised draft Product-Specific Guidances (PSGs) for generic peptides, together with the withdrawal of its May 2021 synthetic peptide guidance framework, sponsors must establish higher-order structure (HOS) and aggregation comparability against Reference Listed Drugs (RLDs) through appropriate orthogonal analytical approaches.
Analytical laboratories supporting peptide sameness and comparability programs, including ResolveMass Laboratories Inc., operating under GMP and GLP quality systems, combine FTIR, Raman spectroscopy, Confocal Raman Mapping, circular dichroism, nuclear magnetic resonance (NMR), and high-resolution mass spectrometry. Integrating these techniques helps identify structural variations that may remain undetected when relying on a single optical analytical method.
Share via:
Quick Summary:
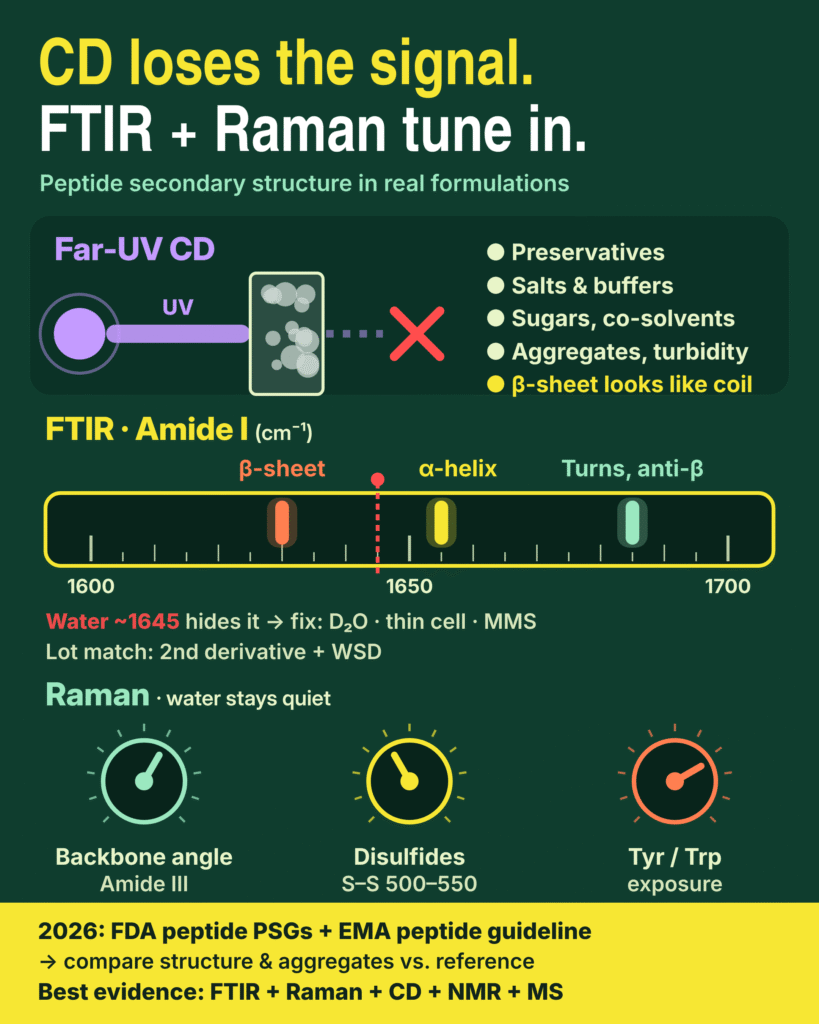
- Why CD falls short: Far-UV CD works well for dilute peptides in clean buffers. It becomes unreliable in real formulations, where preservatives (phenol, m-cresol, benzyl alcohol), chloride salts, many buffers, sugars and co-solvents absorb far-UV light and saturate the detector.
- Aggregates and short peptides confuse CD: Turbid samples, fibrils and lipid systems distort CD spectra through absorbance flattening and light scattering. CD also struggles to tell β-sheet types apart, and some β-structures look like random coil.
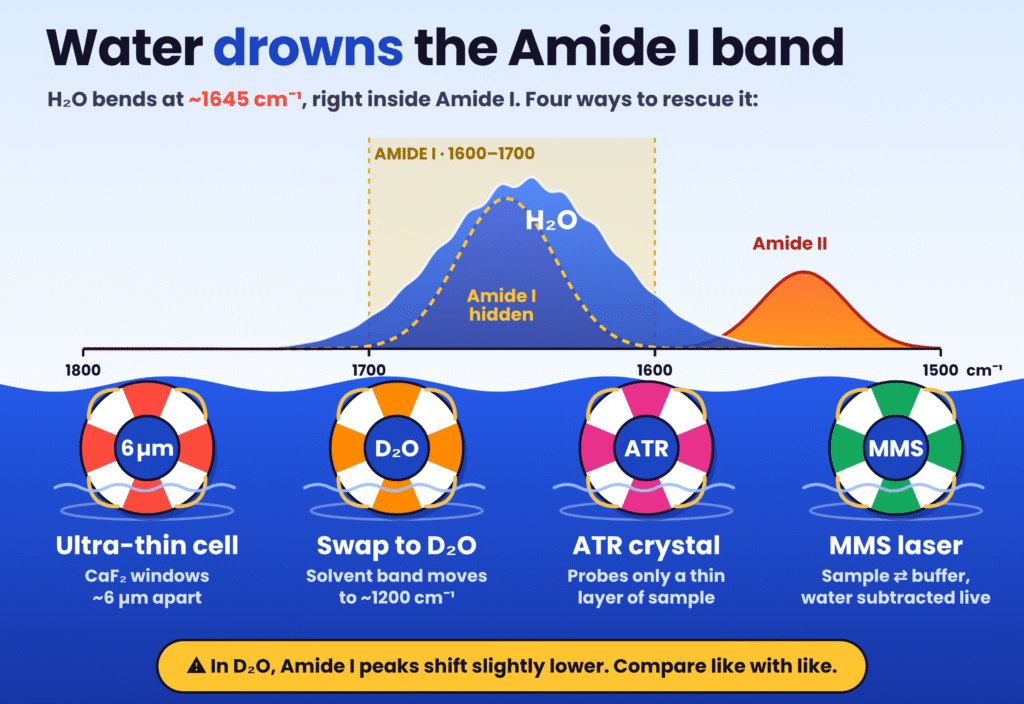
- FTIR reads the Amide I band (1600–1700 cm⁻¹): This band separates α-helix, β-sheet (parallel vs antiparallel), turns and aggregation-related intermolecular β-sheet. Water’s absorbance near 1645 cm⁻¹ overlaps it, so labs use ultrathin CaF₂ cells, D₂O exchange, ATR or Microfluidic Modulation Spectroscopy (MMS).
- Better data analysis: Second-derivative and Fourier self-deconvolution sharpen the broad Amide I band. Similarity algorithms such as Weighted Spectral Difference (WSD), along with PCA and SIMCA, give objective lot-to-lot comparisons instead of visual judgement.
- Raman adds what FTIR misses: Water scatters weakly, so Raman can measure formulated, frozen or solid samples directly. In one measurement it reports backbone ψ angles (Amide III), disulfide geometry (S–S at 500–550 cm⁻¹) and tyrosine/tryptophan exposure. Variants such as drop-coating, UV resonance Raman, ROA and SERS extend it to low concentrations.
- 2026 regulatory push: On 28 July 2026, FDA revised 17 draft peptide PSGs, which recommend comparing higher-order structure and aggregates against the reference product, and withdrew its 2021 synthetic peptide guidance. EMA’s synthetic peptide guideline took effect on 1 June 2026. Generics that change a preservative, buffer or antioxidant must show the change doesn’t affect safety or efficacy.
- Bottom line: No single method is enough. Combining FTIR, Raman, CD, NMR and high-resolution MS gives the strongest evidence of structural and aggregation comparability for IND, NDA and ANDA submissions.
Why Circular Dichroism Breaks Down in Formulated and Aggregating Peptides
Far-UV CD evaluates the difference in absorption between left- and right-circularly polarized light across peptide bond π→π* (190–200 nm) and n→π* (210–220 nm) transitions. Since these measurements are highly sensitive to background chromophores, sample heterogeneity, and overlapping structural reference spectra, changes in sample composition can compromise the resulting data.
When peptide samples move away from idealized, dilute, salt-free buffer conditions, these optical limitations can affect both spectral interpretation and the accuracy of secondary structure calculations.
Excipient UV Cutoffs, Formulation Preservatives, and Concentration Constraints
Far-UV CD measurements can become unreliable when formulation components absorb strongly below 210 nm, causing the detector High Tension (HT) voltage to exceed its operating range and approach saturation limits of approximately 600–700 V. Peptide formulations and synthesis media frequently contain stabilizers, preservatives, salts, and co-solvents that restrict the usable far-UV measurement window.
Important sources of interference include:
Antimicrobial preservatives and aromatic additives: Multi-dose parenteral formulations frequently contain phenol, m-cresol, or benzyl alcohol. Benzyl alcohol has been specifically documented as capable of overloading CD detectors and narrowing the available measurement range. Phenolic preservatives also absorb UV radiation, potentially masking peptide transitions at shorter wavelengths.
Chloride salts and carboxylic or sulfonate buffers: When standard 1 mm cuvettes are used, 100 mM NaCl or KCl can reduce reliable transmission below 195 nm. In PBS or Tris/NaCl systems, the cutoff may shift to approximately 200–201 nm. Buffers containing carbonyl or sulfonate groups, including acetate, citrate, glycine, HEPES, MES, and PIPES, can also produce substantial interference in the far-UV region.
Cryoprotectants, reducing agents, and co-solvents: Sugars used to protect peptides against aggregation can absorb strongly in the far-UV and may also contribute intrinsic chiral CD signals. Similarly, 20% glycerol can restrict measurements to wavelengths of 200 nm or higher. DMSO, formamides, imidazole, urea, and guanidine exhibit strong absorption below 200 nm. Reducing agents, including DTT and β-mercaptoethanol, can also interfere considerably unless their concentrations are maintained at approximately 1 mM or replaced with stoichiometric TCEP.
To minimize absorbance saturation, analysts commonly exchange samples into 10 mM phosphate buffers containing fluoride or sulfate counter-ions, which remain transparent down to approximately 185 nm. Another approach involves diluting concentrated products to 0.1–1.0 mg/mL and measuring them in 0.1–1 mm cuvettes.
However, these adjustments can introduce another analytical problem. Peptide folding and non-covalent self-association are strongly influenced by pH, ionic strength, concentration, and stabilizing excipients. Consequently, diluting a concentrated drug product or removing preservatives may disturb the native oligomerization equilibrium that the analysis is intended to characterize.
Fluorinated co-solvents, such as trifluoroethanol (TFE) and hexafluoroisopropanol (HFIP), offer transparency below 185 nm but can alter the native conformation of polypeptides rather than accurately representing their original formulated state. Covalent fluorophore labels, including rhodamine B and carboxyfluorescein, can introduce additional complications. Their interaction with tryptophan residues through exciton coupling may generate extrinsic Cotton effects between 225 and 260 nm, overlapping the peptide n→π* transition and potentially affecting folding assignments.
For a broader understanding of how formulation conditions influence peptide degradation and structural integrity, explore GLP-1 peptide stability and analytical methods.
Differential Absorbance Flattening and Conformational Blind Spots
When peptides form amyloid fibers, become incorporated into lipid vesicles, bind to nanoparticles, or produce turbid suspensions, far-UV CD measurements can be affected by differential absorbance flattening and differential light scattering.
In these systems, chromophores may become concentrated within dense and structurally heterogeneous regions rather than remaining evenly distributed throughout the sample. As light passes through these chromophore-rich particles, absorption can become nonlinear. Electronic transitions with higher extinction coefficients, particularly the intense π→π* band around 190 nm, may experience greater amplitude suppression than weaker transitions near 222 nm. This unequal attenuation changes spectral shapes and peak ratios used for secondary structure deconvolution.
At the same time, particles with dimensions comparable to UV wavelengths can scatter left- and right-circularly polarized light differently. This produces forward-scattering artifacts, which may become more pronounced in conventional rectangular cuvettes than in circular cells.
Even in optically clear solutions, far-UV CD has important conformational limitations when examining short peptides and β-sheet-rich structures. Short antimicrobial and cell-penetrating peptides containing approximately 5–40 residues may appear predominantly unordered in aqueous buffers, generally producing a negative band near 197–200 nm. Glycine-rich sequences also exhibit relatively weak optical activity because of their structural characteristics.
Charged disordered chains may adopt extended poly-L-proline II (PPII)-like conformations, further complicating random-coil deconvolution. A particularly important limitation concerns the interpretation of β-sheet structures. Parallel and antiparallel strand orientations, together with differences in β-sheet twisting, can generate substantially different far-UV spectra. In addition, βII structures may exhibit CD signatures that closely resemble those of random coils.
Singular value decomposition (SVD) algorithms can therefore produce inaccurate estimates for β-sheets and turns unless the measured spectra extend to wavelengths of 184 nm or lower. These algorithms are also unsuitable for certain short polypeptides and protein fragments.
Consequently, CD spectra can sometimes provide misleading visual impressions of peptide conformation. For example, the CD spectrum of CheY resembles that of an α-helical structure despite the protein containing a substantial β-sheet component. Similarly, conventional CD deconvolution initially failed to identify the α-helical component of amyloid-β (Aβ1-40), which FTIR detected at 1656 cm⁻¹. The α-helical contribution became identifiable only after the data were reprocessed using specialized neural-network software, K2D2.
For a closer look at CD-based approaches and their role in evaluating peptide conformational changes, see CD spectroscopy for peptide secondary structure characterization.
FTIR and Raman Spectroscopy for Peptide Secondary Structure: Orthogonal Vibrational Mechanics
FTIR and Raman spectroscopy for peptide secondary structure use complementary physical mechanisms: mid-infrared photon absorption and inelastic light scattering. These techniques examine peptide backbone conformations in aqueous solutions, films, suspensions, and lyophilized solids without depending on UV transparency.
Both methods are non-destructive and can operate with relatively small sample quantities. Conventional Raman measurements may require approximately 10 µL, while FTIR commonly uses around 10–20 µL. This limited sample requirement can also allow material recovery for subsequent orthogonal bioassays.
Amide Band Sensitivity in FTIR and Raman Spectroscopy for Peptide Secondary Structure
Repeating trans-peptide units generate nine characteristic vibrational modes, identified as Amide A, Amide B, and Amide I–VII. Among these, Amide I, Amide II, Amide III, and Amide A are particularly important for characterizing peptide secondary structure through FTIR and Raman spectroscopy.
The Amide I band, generally observed between 1600 and 1700 cm⁻¹, primarily originates from backbone C=O stretching, contributing approximately 70–85% of the vibration. C-N stretching accounts for around 10–20%, with a smaller contribution from N-H bending.
Its sensitivity to hydrogen-bonding arrangements and nearest-neighbor vibrational coupling makes Amide I particularly valuable for distinguishing α-helices from 3₁₀-helices, identifying parallel and antiparallel β-sheet arrangements, and detecting intermolecular β-sheet formation associated with aggregation.
The Amide II band appears approximately between 1510 and 1580 cm⁻¹. Its vibrational contributions include in-plane N-H bending (40–60%), C-N stretching (18–40%), and a smaller contribution from C-C stretching of approximately 10%.
Although Amide II generally offers less structural discrimination than Amide I in conventional static FTIR measurements, it can become strongly enhanced through approximately 200 nm UV resonance Raman excitation. The band also provides information about hydrogen/deuterium exchange (HDX) and solvent accessibility. Changes in membrane-peptide orientation can additionally be evaluated through Amide I/II intensity ratios.
At lower frequencies, the Amide III band occurs between approximately 1200 and 1340 cm⁻¹. It involves coupled C-N stretching (around 40%), N-H bending (approximately 30%), and conformation-dependent Cα-H bending.
Routine Amide III quantification in FTIR can be complicated by overlapping side-chain contributions and force-field effects. In Raman spectroscopy, however, Amide III experiences substantially less water interference than Amide I and can provide information about local peptide-bond geometry without the same degree of nearest-neighbor coupling.
Amide A, typically located between 3225 and 3280 cm⁻¹, consists of more than 95% N-H stretching. Although this vibration is largely independent of backbone dihedral angles, it is useful for evaluating hydrogen-bond strength and donor–acceptor distances, generally reported in the range of 2.69–2.85 Å.
The following table summarizes established vibrational assignments used in FTIR and Raman spectroscopy to characterize peptide backbone conformations and diagnostic side-chain features.
| Vibrational Region / Probe | Spectral Range (cm⁻¹) | Primary Modality | Structural or Microenvironmental Assignment |
|---|---|---|---|
| Amide I (α-Helix) | 1650–1659 | FTIR / Raman | Characteristic α-helical C=O stretching associated with i → i+4 hydrogen bonding; aqueous Raman measurements commonly show a trend near 1656 cm⁻¹ |
| Amide I (3₁₀-Helix) | 1600–1700 (doublet in 2D IR) | FTIR / 2D IR | Tighter i → i+3 hydrogen bonding; identified through a characteristic cross-peak doublet in 2D IR |
| Amide I (β-Sheet, Low Frequency) | 1620–1647 | FTIR / Raman | Intramolecular and intermolecular β-sheet strands, including bands around 1628–1633 cm⁻¹ in Aβ1-40 and concanavalin A |
| Amide I (β-Sheet, High Frequency) | 1665–1694 | FTIR / Raman | High-frequency β-sheet band, with a Raman trend near 1672 cm⁻¹; approximately 1690–1694 cm⁻¹ can indicate antiparallel or oligomeric β-sheets |
| Amide I (β-Turn) | 1670–1699 | FTIR / Raman | Four-residue reversal turns, with representative bands near 1670, 1676, and 1680 cm⁻¹ |
| Amide II | 1510–1580 | FTIR / UVRR | In-plane N-H bending and C-N stretching; evaluates HDX-related burial and membrane orientation through Amide I/II ratios |
| Amide III | 1200–1340 | Raman / UVRR / FTIR | Uncoupled C-N, N-H, and Cα-H vibrational contributions; AmIII3s tracks ψ-angle variation, while perturbation-sensitive markers occur at 1230–1300 cm⁻¹ |
| Skeletal C-C / C-N Stretch | 930–950 | Raman | Backbone skeletal stretching associated with α-helical conformation |
| Disulfide Stretch (S-S) | 500–550 (typically 510–540) | Raman | Identifies -C-C-S-S-C-C- GGG, TGG, and TGT conformers, including signals around 540–545 cm⁻¹; complemented by C-S (630–760 cm⁻¹) and free -SH (2500–2600 cm⁻¹) |
| Tyrosine Fermi Doublet | ~830 and ~850–860 | Raman | I856/I830 ratio (0.3–6.7) provides information about phenolic hydrogen bonding, solvent exposure, and aggregation |
| Tryptophan Doublet and W3 | ~1360 / ~1340; W3 ~1540–1550 | Raman / ROA | The 1360/1340 ratio indicates hydrophobic or hydrophilic environments; W3 frequency and ROA sign provide information about indole χ2,1 torsion geometry |
| Side-Chain Overlaps / References | 1000 (Raman); 1400, 1498, 1515 (FTIR) | Raman / FTIR | Phenylalanine ring stretching near 1000 cm⁻¹ as a pre-aggregation marker; COO⁻ near 1400 cm⁻¹, Asp at 1498 cm⁻¹, and Tyr at 1515 cm⁻¹ |
Amino acid side chains can introduce additional complexity because their vibrational signals may overlap with the peptide amide envelope. Tyrosine around 1515 cm⁻¹, aspartic acid near 1498 cm⁻¹, and carboxylate groups around 1400 cm⁻¹ are particularly relevant examples.
Peptide aggregation may also generate new Amide I features that could be incorrectly assigned to native secondary structure. Careful spectral interpretation and band assignment are therefore essential for obtaining reliable structural information.
Partial HDX-FTIR can improve this discrimination by introducing controlled deuteration. For α-helix prediction, the root mean square error of cross-validation (RMSECV) decreases from 6.24% at t0 to 5.68% after 15 minutes. This approach also improves the estimation of disordered and turn structures, grouped as “Others.” In contrast, non-deuterated spectra generally provide better accuracy when determining β-sheet fractions.
For additional structural information from complementary NMR measurements, explore 2D NMR for peptide characterization.
Resolving Water Interference Through Ultrashort Cells, D2O Exchange, and Microfluidic Modulation
One of the major experimental difficulties in aqueous peptide FTIR is the strong H-O-H bending vibration of water, which occurs near 1645 cm⁻¹. Since this signal overlaps directly with the Amide I region, it can interfere with the interpretation of peptide backbone vibrations.
Several sampling approaches are used to minimize this solvent-related interference.
Ultrashort-pathlength transmission cells (CaF2): Reducing the optical pathlength to approximately 10 µm (0.01 mm) makes it possible to measure Amide I vibrations in H₂O. Increasing the pathlength to 0.025 mm (25 µm), however, can produce excessive water absorption and obscure peptide signals. Variations in window surface roughness may also introduce pathlength inconsistencies. Reliable background correction therefore requires appropriately matched formulation dialysates, which can be prepared through gentle overnight dialysis, along with confirmation that the adjacent water reference band is effectively flattened.
D₂O solvent exchange: Replacing H₂O with heavy water shifts the solvent bending vibration toward lower wavenumbers, reducing its overlap with the Amide I region. However, analysts must account for a downward shift of approximately 5–15 cm⁻¹ in Amide I peak positions following H/D exchange. Differences in proton exchange accessibility between disordered regions and buried hydrogen-bonded cores must also be considered during interpretation.
Attenuated Total Reflection (ATR) and IRRAS: Liquid BioATR systems can accommodate approximately 20 µL of solution at concentrations around 20 mg/mL. Micro-sampling ATR provides another option by drying 10 µL droplets prepared from 1 mg/mL stock solutions directly onto the crystal surface. This approach requires buffers with low interference because dissolved salts can become concentrated during drying. Infrared reflection-absorption spectroscopy (IRRAS), meanwhile, enables direct investigation of peptides at air-water interfaces without requiring D₂O exchange.
Microfluidic Modulation Spectroscopy (MMS): A 2020 instrument vendor guide describes MMS as a technique using a quantum cascade laser approximately 1,000 times brighter than conventional FTIR sources. During measurement, the system continuously alternates between the peptide sample and its corresponding buffer within a microfluidic transmission cell.
Peer-reviewed validation studies have demonstrated high linearity across peptide and protein concentrations ranging from 0.5 to 87.4 mg/mL, with an R² value of 0.99867. In an IgG1:BSA spiking model, MMS reduced the limit of quantitation (LOQ) for structural impurities to 0.76%. This performance was better than that reported for far-UV CD (3.7% LOQ) and conventional transmission FTIR (23% LOQ).
A 2020 vendor technical guide also reported linearity values of R² = 0.9997 for MMS, compared with 0.9923 for CD and 0.7721 for traditional FTIR.
Resolution Enhancement and Quantitative Comparability Algorithms
Raw Amide I spectra generally appear broad because the intrinsic widths of individual vibrational bands can exceed the frequency differences separating particular secondary structure components. As a result, overlapping spectral features may be difficult to identify through direct visual examination.
Quantitative analytical workflows address this limitation through resolution-enhancement procedures, primarily second-derivative transformation and Fourier self-deconvolution (FSD). These procedures are generally applied after appropriate water and buffer subtraction to identify underlying spectral peaks before Voigt curve fitting or multivariate chemometric analysis.
Common statistical and computational approaches include principal component analysis (PCA), partial least squares (PLS), singular value decomposition (SVD), and Soft Independent Modeling of Class Analogy (SIMCA).
In regulatory lot-to-lot comparability studies, quantitative similarity algorithms provide a more objective alternative to subjective visual spectral comparisons. Comparative evaluations of Area of Overlap (AOO), Differential Absorbance, Derivative Correlation Algorithm (DCA), and Weighted Spectral Difference (WSD) indicate that WSD can outperform DCA and overlap-based measurements.
Its advantage comes from maintaining a linear response to structural impurities while tolerating minor baseline inclusions. When several replicate lots are assessed under each experimental condition, SIMCA can establish statistically defined boundaries for identifying meaningful conformational differences.
Raman Spectroscopy Beyond the Backbone: Dihedral Angles, Disulfides, and Microenvironments
Liquid water produces relatively weak Raman scattering, meaning that only limited subtraction of minor O-H bending contributions is generally required. This characteristic allows Raman spectroscopy to characterize peptides in formulated aqueous solutions, frozen matrices down to -80 °C, and solid powders without requiring ultrashort optical cells or D₂O exchange.
Another important advantage is that a single Raman measurement can provide information about backbone torsion geometry, covalent disulfide conformations, and aromatic side-chain environments.
Amide III Psi-Angle Dependence and Skeletal Backbone Modes
Mid-infrared Amide I analysis is strongly influenced by inter-peptide dipole coupling, which changes according to strand length and structural arrangement. By comparison, the Raman Amide III region, approximately 1200–1340 cm⁻¹, provides information about local conformational geometry without the same nearest-neighbor vibrational coupling.
Ultraviolet resonance Raman (UVRR) and computational investigations have established that the AmIII3s vibrational frequency follows a sinusoidal relationship with the Ramachandran ψ dihedral angle. Across sterically permitted conformational space, its sensitivity to ψ is approximately three times greater than its sensitivity to φ.
Since peptide bonds contribute independently to the AmIII3s signal, Raman spectroscopy can distinguish α-helices, 3₁₀-helices, π-bulges, β-strands, and PPII conformations, including in relatively short peptide sequences.
In spontaneous off-resonance Raman measurements, the Amide III region around 1200–1300 cm⁻¹ can detect subtle conformational changes caused by chemical or thermal stress. For example, frozen IgG1 formulations may exhibit distinct spectral features near 1238, 1253, and 1268 cm⁻¹. Similarly, perturbation-related shifts across 1230–1300 cm⁻¹ have been reported in BSA and DNase I.
These assignments can be supported by examining additional backbone vibrations. Skeletal C-C and C-N stretching between 930 and 950 cm⁻¹ is characteristic of α-helical structures. Backbone and aliphatic features near 842 cm⁻¹ provide further information, while aqueous Raman Amide I maxima commonly trend toward approximately 1656 cm⁻¹ for helical structures and 1672 cm⁻¹ for β-sheets.
Evaluating these spectral regions together supports cross-validation of secondary structure assignments across multiple vibrational windows.
Disulfide Rotamers, Aromatic Doublets, and Advanced Raman Modalities
In disulfide-stabilized peptides and therapeutic proteins, tertiary packing and covalent cross-link geometry are important determinants of higher-order structural integrity. Spontaneous Raman spectroscopy can evaluate these features alongside peptide backbone secondary structure.
Disulfide bridge conformations are examined through S-S stretching vibrations in the 500–550 cm⁻¹ region, typically between 510 and 540 cm⁻¹. These signals can distinguish -C-C-S-S-C-C- disulfide bridges into GGG, TGG, and TGT torsional conformers, including characteristic TGT-related signals around 540–545 cm⁻¹.
Additional information is obtained through C-S stretching between 630 and 760 cm⁻¹ and free reduced sulfhydryl (-SH) stretching between 2500 and 2600 cm⁻¹. Monitoring S-S cleavage together with Amide III changes during TCEP reduction and pH stress can directly connect the disruption of covalent cross-links with subsequent backbone unfolding.
Aromatic side-chain Fermi doublets provide another important source of structural information, particularly regarding solvent exposure and early aggregation.
The tyrosine doublet, generally observed around 830 and 850–860 cm⁻¹, produces an intensity ratio (I856/I830) ranging from approximately 0.3 to 6.7. This ratio helps indicate whether phenolic hydroxyl groups function as solvent-exposed hydrogen-bond acceptors, generally associated with ratios above 1, or occupy more buried environments. These changes can serve as indicators of hydration differences and aggregation during freeze–thaw stress.
Similarly, the tryptophan doublet around 1360 and 1340 cm⁻¹ can distinguish hydrophobic burial from hydrophilic exposure. Ratios above 1.1 are associated with hydrophobic environments, whereas values below 0.9 indicate more hydrophilic surroundings.
The Trp W3 mode, located around 1540–1550 cm⁻¹, provides information about indole χ2,1 torsion geometry. The phenylalanine band near 1000 cm⁻¹ can also serve as a reference marker for monitoring changes preceding aggregation.
Conventional spontaneous Raman spectroscopy has a relatively weak scattering cross-section and may therefore require solution concentrations of approximately 10–12.5 mg/mL. Fluorescence backgrounds and chromophore interference can create additional difficulties, including pyrroline interference in certain heme proteins.
Specialized Raman techniques help address these limitations and extend the method to lower-concentration peptide applications.
Drop-Coating Deposition Confocal Raman (DCDCR / DCDR): This approach involves drying approximately 10 µL droplets, including samples prepared from 100 µM peptide solutions. During evaporation, the analyte becomes concentrated along a coffee-ring deposit. For model proteins, this technique has demonstrated secondary structure predictions within less than 1% of X-ray crystal structure measurements.
UV Resonance Raman (UVRR): Deep-UV excitation near 200 nm accesses the peptide bond π→π* absorption region around 190 nm. This selectively enhances Amide I, Amide II, Amide III, and Cα-H bending vibrations near 1390 cm⁻¹. Excitation at 229 nm can additionally investigate tryptophan and tyrosine at approximately 0.5 µg/µL. Temperature-jump UVRR can also resolve folding pathways involving α-helix, 3₁₀-helix, π-bulge, and PPII conformations.
Raman Optical Activity (ROA): ROA measures the difference in scattering intensity between right- and left-circularly polarized light (IR − IL). This provides direct chiral sensitivity to peptide backbone conformations and helps establish the absolute sign of Trp χ2,1 side-chain torsion angles.
Surface-Enhanced Raman (SERS) and Low-Frequency Raman (LF-Raman): SERS enhances vibrational signals from trace analytes and supports on-bead peptide barcoding and amyloid fibril analysis when combined with 2D correlation spectroscopy and PCA. LF-Raman examines collective supramolecular packing within β-sheet fibrils and can distinguish diastereomeric peptide analogues that may not be differentiated through conventional high-frequency scans.
For further insight into analytical approaches used to evaluate peptide aggregation and associated structural changes, see peptide aggregation analysis.
Comparing Circular Dichroism, FTIR, and Raman Spectroscopy for Peptide Workflows
Effective peptide characterization requires selecting analytical methods according to their physical measurement principles, sample matrix compatibility, concentration requirements, and intended structural endpoints.
The following comparison summarizes the operational characteristics of far-UV CD, conventional and ATR-FTIR, MMS, and different Raman platforms.
| Analytical Parameter | Far-UV Circular Dichroism | Conventional / ATR-FTIR | Microfluidic Modulation Spectroscopy (MMS) | Raman / DCDR / UVRR |
|---|---|---|---|---|
| Physical Observable | Differential absorption of LCP and RCP UV light (π→π*, n→π*) | Mid-IR photon absorption involving Amide I, II, III, and A | Quantum cascade laser-based mid-IR differential modulation, primarily involving Amide I | Inelastic light scattering involving Amide I, III, S-S, and aromatic vibrations |
| Typical Concentration and Volume | 0.1–1.0 mg/mL (0.1–1 mm cell; approximately 0.03–0.04 mg mass; up to 23.1 mg/mL in a 0.01 mm cell) | 6–20+ mg/mL (transmission/BioATR, 10–20 µL); 1 mg/mL dried ATR samples (10 µL) | 0.5–87.4 mg/mL (up to 40 pairs/plate; R² = 0.99867) | Approximately 10–12.5 mg/mL aqueous solutions (10 µL); 100 µM for DCDR; approximately 0.5 µg/µL for UVRR |
| Aqueous and Excipient Tolerance | Limited below 200 nm in the presence of Cl⁻, benzyl alcohol, phenols, acetate, citrate, DMSO, and sugars | Strong H₂O overlap around 1645 cm⁻¹; requires 10 µm CaF₂ cells, D₂O exchange, or accurate buffer matching | High tolerance; continuous sample/buffer modulation helps subtract water and complex excipient backgrounds | High tolerance; water produces weak Raman scattering, supporting analysis of salts, preservatives, and frozen samples |
| Turbidity, Membrane, and Aggregate Performance | Affected by differential absorbance flattening and differential light scattering | Can characterize solids, films, lipid interfaces through IRRAS, and intermolecular β-sheet aggregates | Achieves 0.76% structural impurity LOQ in the IgG1:BSA model and monitors thermal β-sheet aggregation | Characterizes fibril polymorphs, organogels, and freeze–thaw transitions down to -80 °C |
| Conformational and Tertiary Strengths | Rapid α-helix detection through 208/222 nm signals and thermal melting (Tm) screening | Identifies parallel and antiparallel β-sheets, β-turns, 3₁₀-helices through 2D IR, and HDX kinetics | Provides high-precision Amide I comparability using WSD/AOO at low impurity levels | Evaluates Ramachandran ψ-angle variation through AmIII3s, S-S rotamers (GGG/TGG/TGT), and Tyr/Trp exposure |
| Primary Operational Bottlenecks | UV cutoffs, concentration-related errors in MRE, and βII/PPII ambiguity | 23% LOQ in the transmission model and CaF₂ pathlength variability | Requires dedicated QCL instrumentation and primarily examines the Amide I region | Weak spontaneous scattering signal and possible fluorescence or heme pyrroline interference |
For early discovery screening in transparent 10 mM phosphate buffers, far-UV CD remains a practical option. It can provide rapid conformational screening in approximately 10 minutes per sample while requiring no more than 20 µg of material.
However, as peptide candidates progress into preserved formulations, higher-concentration preparations, and forced-degradation studies, vibrational spectroscopy becomes increasingly important as a primary analytical approach.
Combining FTIR Amide I measurements, which are sensitive to inter-strand vibrational coupling, with Raman Amide III and disulfide/aromatic markers provides a broader understanding of peptide structure. This combination evaluates local ψ dihedral geometry and covalent bridge conformations alongside backbone organization, offering complementary structural information.
Regulatory Expectations for Peptide Higher-Order Structure in 2026
Regulatory frameworks in North America and Europe during 2026 place increasing importance on demonstrating peptide higher-order structure comparability through multiple analytical techniques. This is particularly relevant when synthetic peptides are compared with recombinant RLDs or when changes are introduced into parenteral excipient compositions.
On 28 July 2026, the FDA published 17 revised draft Product-Specific Guidances covering nine reference peptide active ingredients: calcitonin salmon, dasiglucagon hydrochloride, glucagon, liraglutide, pegcetacoplan, semaglutide, teriparatide, tirzepatide, and vosoritide. At the same time, the agency withdrew its May 2021 synthetic peptide ANDA guidance in preparation for a replacement framework.
These developments, together with the European Medicines Agency (EMA) synthetic peptide guideline (EMA/CHMP/CVMP/QWP/367182/2025), effective 1 June 2026, highlight several important areas of regulatory assessment.
The main considerations include manufacturing origin, innate immune response risk, impurity thresholds, higher-order structure, and biological activity. Representative 2026 draft PSGs include impurity reporting levels above 0.1% and identification thresholds above 0.5%.
Under 21 CFR 320.22(b)(1) and 314.94(a)(9)(iii), parenteral generic products seeking in vivo bioequivalence waivers must demonstrate qualitative (Q1) and quantitative (Q2) equivalence of inactive ingredients to the RLD. The stated Q2 requirement is within ±5%.
When a sponsor modifies a preservative, buffer, or antioxidant, it must identify and characterize the relevant excipient differences and demonstrate that these changes do not adversely affect product safety or efficacy. Consequently, evaluating higher-order structure and aggregation directly within the formulated matrix becomes an important part of the comparability strategy.
Far-UV CD may not adequately characterize preserved formulations without dilution or buffer exchange. Therefore, compendial mid-IR spectroscopy (USP ), compendial Raman methods, MMS, and NMR can support more comprehensive structural assessments. These approaches are also consistent with analytical control strategies associated with ICH Q6A and ICH Q14 analytical target profile (ATP) principles.
Comparability programs for complex peptide therapeutics, including semaglutide, tirzepatide, liraglutide, and lanreotide, require access to complementary structural instrumentation and appropriate quality oversight.
At ResolveMass Laboratories Inc., PhD-level analytical scientists use FTIR, Confocal Raman Mapping, CD, NMR, HRMS, HPLC, DSC, and TGA under GMP/GLP-compliant quality systems. These systems incorporate validated computerized data management, calibrated analytical equipment, controlled chain-of-custody procedures, and independent quality assurance (QA) review.
Combining vibrational secondary structure assessment with high-resolution impurity profiling and orthogonal oligomer characterization helps establish conformational and aggregation equivalence before IND, NDA, or ANDA submissions.
Explore GLP-1 peptide impurity characterization to understand how orthogonal analytical methods can support impurity identification and characterization in peptide development.
Conclusion
Far-UV circular dichroism alone may not provide reliable secondary structure characterization when therapeutic peptides are incorporated into UV-absorbing parenteral formulations, membrane mimics, concentrated self-associating systems, or polymorphic β-sheet aggregates.
FTIR and Raman spectroscopy for peptide secondary structure address these analytical limitations through complementary vibrational measurements. Mid-IR spectroscopy and MMS can characterize parallel and antiparallel β-sheet coupling and detect structural impurities below 1% directly in formulated buffers. Raman spectroscopy, meanwhile, provides information about uncoupled Amide III Ramachandran ψ-angle sensitivity, disulfide GGG/TGG/TGT rotamer geometry, and tyrosine/tryptophan exposure without substantial interference from water.
When these techniques are combined with NMR and high-resolution mass spectrometry, they provide a broader analytical framework for peptide higher-order structure comparability and quality control in line with the heightened FDA and EMA expectations described for 2026.
Pharmaceutical and biotechnology teams developing peptide sameness studies, excipient compatibility assessments, or analytical comparability packages can benefit from working with experienced structural characterization specialists. Access to appropriate FTIR, Raman, CD, NMR, and LC-MS workflows can help strengthen analytical evidence and support regulatory readiness.
Discover the peptide physicochemical characterization services available to support comprehensive structural and analytical assessment of therapeutic peptides.
To discuss customized peptide characterization and analytical testing requirements with the scientific team at ResolveMass Laboratories Inc. in Laval, Quebec, visit the Contact Us page.
Frequently Asked Questions
FTIR examines differences in Amide I vibrations between 1600 and 1700 cm⁻¹, where carbonyl stretching patterns are influenced by peptide hydrogen bonding and inter-strand coupling. Antiparallel and oligomeric β-sheets can produce a characteristic combination of low-frequency bands around 1620–1647 cm⁻¹ and higher-frequency signals between 1665 and 1694 cm⁻¹. These features provide structural details that may be difficult to separate using overlapping far-UV CD signals.
Ingredients such as benzyl alcohol, phenol, m-cresol, chloride salts, acetate, citrate, glycine, DMSO, urea, guanidine, DTT, and sugars can interfere with far-UV CD through strong absorption or additional optical signals. Raman spectroscopy is less affected by aqueous components because water produces relatively weak Raman scattering. MMS and appropriately controlled FTIR measurements can also reduce background interference through matched buffer subtraction.
The water bending vibration near 1645 cm⁻¹ overlaps with the Amide I region, making accurate background correction essential. Analysts can reduce this interference using approximately 10 µm CaF₂ transmission cells, D₂O exchange, ATR-FTIR, or IRRAS. MMS offers another approach by alternating measurements between the peptide solution and its matched buffer, with reported structural impurity quantification reaching an LOQ of 0.76%.
The Raman Amide III region, typically between 1200 and 1340 cm⁻¹, provides useful information about local peptide backbone conformation with relatively little interference from water. Its AmIII3s component changes according to the Ramachandran ψ dihedral angle and has approximately three times greater sensitivity to ψ than to φ. This makes it valuable for distinguishing α-helices, 3₁₀-helices, β-strands, and PPII conformations.
Yes. Raman spectroscopy can examine peptide backbone vibrations together with disulfide bonds and aromatic side-chain environments in the same analytical measurement. S-S stretching signals between 500 and 550 cm⁻¹ help identify GGG, TGG, and TGT conformations, while free -SH vibrations provide information about reduced sulfhydryl groups. Tyrosine and tryptophan spectral doublets further help evaluate hydrogen bonding, solvent exposure, and aggregation-related changes.
Sample requirements depend on the analytical technique and measurement configuration. Far-UV CD commonly uses concentrations of 0.1–1.0 mg/mL, whereas conventional FTIR and spontaneous Raman measurements often require higher concentrations and approximately 10–20 µL of material. Advanced approaches can accommodate lower concentrations, including MMS measurements starting at 0.5 mg/mL, DCDR analysis of 100 µM peptide samples, and UVRR measurements around 0.5 µg/µL.
Amide I spectra often contain several overlapping vibrational components that cannot be reliably separated through visual inspection alone. Second-derivative analysis and Fourier self-deconvolution (FSD) help reveal these individual bands before curve fitting and quantitative evaluation. For lot-to-lot comparisons, Weighted Spectral Difference (WSD) provides a quantitative way to identify structural variations while maintaining sensitivity to impurities and accommodating minor baseline differences.
Specialized Raman methods improve structural analysis when conventional Raman scattering is too weak or background interference becomes problematic. DCDR concentrates dilute peptide samples into a small deposit, improving signal collection, while UVRR uses near-200 nm excitation to enhance peptide backbone vibrations. Raman Optical Activity (ROA) measures differences between right- and left-circularly polarized scattering, providing additional information about backbone chirality and tryptophan χ2,1 torsion geometry.
The FDA’s 17 revised draft peptide Product-Specific Guidances, published on 28 July 2026, place importance on higher-order structure and aggregation assessments alongside impurity control, manufacturing origin, immune response risk, and biological activity. Generic peptide developers must establish appropriate comparability with the Reference Listed Drug (RLD). When formulation components such as preservatives, buffers, or antioxidants differ, sponsors need suitable analytical evidence to demonstrate that these changes do not compromise product safety or efficacy.
Reference:
- Micsonai, A., Wien, F., Kernya, L., Lee, Y.-H., Goto, Y., Réfrégiers, M., & Kardos, J. (2015). Accurate secondary structure prediction and fold recognition for circular dichroism spectroscopy. Proceedings of the National Academy of Sciences, 112(24), E3095–E3103. https://doi.org/10.1073/pnas.1500851112
- Greenfield, N. J. (2006). Using circular dichroism spectra to estimate protein secondary structure. Nature Protocols, 1(6), 2876–2890. https://doi.org/10.1038/nprot.2006.202
- Maggio, E. T. (2010). Use of excipients to control aggregation in peptide and protein formulations. Journal of Excipients and Food Chemicals, 1(2), 40–49. https://www.researchgate.net/publication/46286755_Use_of_excipients_to_control_aggregation_in_peptide_and_protein_formulations
- U.S. Food and Drug Administration. (2026, July 28). FDA publishes revised draft product-specific guidances for certain generic peptide products. U.S. Department of Health and Human Services. https://www.fda.gov/drugs/drug-alerts-and-statements/fda-publishes-revised-draft-product-specific-guidances-certain-generic-peptide-products
- Jiao, T. (2024, September 25). Teriparatide injection first generic approval: Quality-related review considerations [Conference presentation]. U.S. Food and Drug Administration, Center for Drug Evaluation and Research. https://www.fda.gov/media/184411/download
- U.S. Food and Drug Administration. (2026). Product-specific guidance on tirzepatide injection (NDA 215866). U.S. Department of Health and Human Services. https://www.accessdata.fda.gov/drugsatfda_docs/psg/PSG_215866.pdf
Get In Touch With Us
About The Author