


Introduction
Statistical Approaches to Analytical Similarity encompass quantitative, risk-based frameworks used by regulatory authorities and biopharmaceutical developers to establish that a proposed biosimilar drug product is highly similar to its originator biological reference product, despite the inherent molecular heterogeneity of biological medicines. Through the application of appropriate mathematical models, including Two One-Sided Tests (TOST) and standard deviation-based quality ranges, sponsors demonstrate that minor physicochemical or functional differences do not adversely affect clinical safety, purity, or potency.
Establishing analytical comparability under Section 351(k) of the Public Health Service Act requires comprehensive characterization of critical quality attributes (CQAs). Because biological therapeutics originate from living cell lines, natural batch-to-batch variability can arise from post-translational modifications, including glycosylation, charge variants, and aggregation. The United States Food and Drug Administration (FDA) evaluates comparative analytical datasets using a totality-of-the-evidence approach, which integrates orthogonal structural and functional characterization with rigorous biostatistical analyses. Generating precise and reliable comparative data through advanced analytical testing is therefore fundamental to supporting an expedited, risk-reduced regulatory approval pathway.
Explore biosimilar characterization services to support comprehensive analytical evaluation of biological products.
Share via:
Quick Summary:
- Purpose: Statistical approaches to analytical similarity help show that a proposed biosimilar is highly similar to its reference product. They show that small differences in quality attributes do not affect safety, purity or potency.
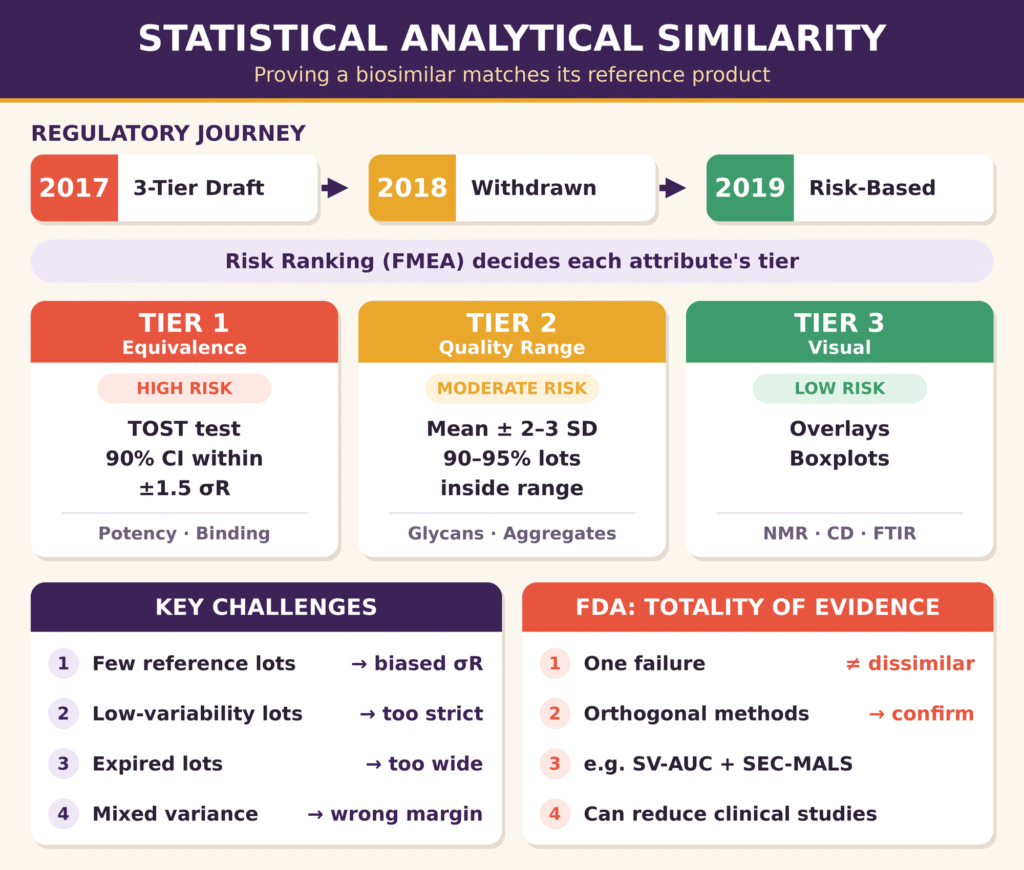
- Regulatory evolution: The FDA’s 2017 draft guidance proposed a fixed three-tier statistical framework but was withdrawn in 2018. The 2019 draft guidance replaced it with a flexible, risk-based comparative analytical assessment, in which sponsors justify their statistical methods attribute by attribute.
- Tier 1 (equivalence testing): High-risk attributes tied to the mechanism of action, such as potency and target binding, are tested with Two One-Sided Tests (TOST). Under the historical framework, the 90% confidence interval of the mean difference had to fall within ±1.5σR.
- Tier 2 (quality ranges): Moderate-risk attributes such as charge variants, glycans and aggregates are compared against a range of the reference mean ± 2–3 SD. Typically 90–95% of biosimilar lots are expected to fall inside that range.
- Tier 3 (visual comparison): Low-risk or qualitative attributes, such as higher-order structure from NMR, CD and FTIR, are assessed with spectral overlays, chromatographic traces and boxplots.
- Methodological challenges: Small numbers of reference lots, lot selection bias and mixing between-lot and within-lot variance can distort σR. Low-variability lots make margins too strict, while expired lots make them too wide. Risk-ranking tools like FMEA support a scientifically justified tier assignment.
- Totality of evidence: The FDA weighs all structural and functional data together, so a single statistical failure does not automatically mean a product is dissimilar. Orthogonal methods such as SV-AUC with SEC-MALS strengthen the evidence and can support reduced clinical studies.
The Regulatory Evolution of Statistical Approaches to Analytical Similarity
The regulatory framework governing statistical approaches to analytical similarity has evolved from prescriptive, tier-based draft guidelines toward a flexible, risk-informed paradigm for comparative analytical assessment. This development enables sponsors to select and justify statistical methodologies according to the criticality of individual attributes, analytical method sensitivity, and observed lot variability rather than relying exclusively on predetermined mathematical acceptance margins.
The 2017 Draft Guidance and Its Mathematical Limitations
The FDA’s 2017 draft guidance introduced a formal three-tiered statistical framework for evaluating comparative analytical data. However, the guidance was withdrawn in June 2018 following the identification of statistical and operational limitations. Industry specialists and biostatisticians demonstrated that applying fixed margins based on the sample standard deviation of a limited number of reference product lots could introduce statistical bias and produce disproportionately high failure rates.
In its September 2017 draft guidance, titled Statistical Approaches to Evaluate Analytical Similarity, the FDA proposed assessing CQAs through three distinct statistical tiers: Equivalence Testing for Tier 1, Quality Ranges for Tier 2, and Visual Comparison for Tier 3. However, technical investigations conducted by academic biostatisticians, particularly Wang and Chow, identified substantial limitations in treating sample standard deviations (SR) calculated from a small number of reference lots as though they were fixed population parameters (σR). This assumption could distort equivalence limits defined as ±1.5σR. When the selected reference lots exhibited naturally low variability, the resulting equivalence margin could become excessively restrictive, potentially causing genuine reference product lots to fail equivalence testing against other lots of the same product. These concerns contributed to the FDA’s decision to withdraw the draft guidance in June 2018 and reassess the statistical framework to support more flexible regulatory approaches.
Modern Comparative Analytical Assessment Standards
Current FDA expectations, reflected in the 2019 draft guidance titled Development of Therapeutic Protein Biosimilars: Comparative Analytical Assessment, emphasize comprehensive risk ranking and orthogonal analytical characterization rather than relying exclusively on rigid statistical pass/fail criteria. This approach allows sponsors to justify their chosen statistical models based on the biological function, abundance, distribution, and potential clinical consequences of each individual attribute.
The updated framework emphasizes comparative analytical assessment strategies that consider manufacturing process characteristics, lot age, and analytical method capabilities. Rather than requiring Two One-Sided Tests for predefined groups of attributes irrespective of their scientific significance, regulators assess whether the complete analytical evidence demonstrates structural and functional similarity. Advanced analytical testing laboratories use high-resolution liquid chromatography-mass spectrometry (LC-MS), analytical ultracentrifugation (AUC), and cell-based potency bioassays to generate the comprehensive, multi-attribute datasets needed to support comparative analytical assessments under FDA expectations.
Learn how structured biosimilar comparability studies help evaluate analytical differences between a proposed biosimilar and its reference product.
The Three-Tiered Framework for Evaluating Critical Quality Attributes
The three-tiered analytical evaluation framework classifies the quality attributes of a biological product into separate statistical assessment categories according to their clinical risk and relationship to the product’s mechanism of action. Attributes associated with the highest clinical risk undergo rigorous hypothesis testing under Tier 1, moderate-risk attributes are evaluated using statistical quality ranges under Tier 2, and lower-risk or non-quantifiable characteristics are assessed through direct visual comparison of analytical data under Tier 3.
Tier 1: Two One-Sided Tests (TOST) and Equivalence Margin Derivation
Tier 1 statistical assessment uses Two One-Sided Tests (TOST) to establish that the difference between the mean values of a proposed biosimilar and its reference product lies within a predefined equivalence margin (±1.5 · σR). This approach is intended for high-risk critical quality attributes (CQAs) that are directly associated with the biological product’s primary mechanism of action (MoA).
For Tier 1 equivalence testing, statistical hypotheses are established to determine whether the difference between the population mean of the biosimilar (μT) and that of the reference product (μR) falls within the specified equivalence limits, denoted by δ:
H01: μT − μR ≤ −δ or H02: μT − μR ≥ δ
HA: −δ < μT − μR < δ
The standard equivalence margin described in the historical regulatory framework is calculated as follows:
δ = 1.5 · σR
Here, σR denotes the standard deviation of the reference product, estimated using historical lot characterization data. To satisfy Tier 1 equivalence testing at a significance level of α = 0.05, the 90% confidence interval for the mean difference (μT − μR) must lie entirely within the interval (−1.5σR, 1.5σR). When pharmacokinetic endpoints or biological potency assay results follow log-normal distributions, the data are logarithmically transformed before calculating the confidence interval.
Tier 2: Quality Ranges and Multi-Standard Deviation Bounds
Tier 2 assessment uses quality ranges, expressed as μR ± c · σR, to determine whether a specified proportion of biosimilar lot measurements falls within the historical variability limits established for the reference product. This approach is applied to moderate-to-high-risk attributes when demonstrating strict equivalence between population means is mathematically impractical or scientifically unnecessary.
Quality ranges can be used to evaluate attributes such as charge variants, glycan profiles, and size variants, including aggregates and fragments. The mathematical expression for the acceptance interval is:
QR = X̄R ± c · SR
In this equation, X̄R represents the sample mean of the reference product lots, SR denotes the sample standard deviation, and c is a multiplier that may typically range from 2 to 3, depending on the selected statistical approach. Acceptance criteria may specify that approximately 90% to 95% of biosimilar lot measurements should fall within the established quality range. This method helps prevent excessively restrictive criteria for attributes that naturally exhibit batch-to-batch variability while preserving appropriate regulatory oversight of analytical similarity.
Discover analytical approaches for charge variant analysis in biosimilars to support the investigation of molecular heterogeneity.
Tier 3: Visual Comparison and Graphical Overlays
Tier 3 assessment relies on direct visual comparisons, graphical spectral overlays, and descriptive summary statistics to evaluate lower-risk quality attributes or continuous structural spectra. This approach is appropriate when formal statistical hypothesis testing based on quantitative point estimates is unsuitable because of the complexity of the data or the relatively low clinical risk associated with the attribute.
Tier 3 assessments may include Higher-Order Structure (HOS) fingerprints generated using Far-UV/Near-UV Circular Dichroism (CD), Fourier-Transform Infrared Spectroscopy (FTIR), 1D/2D Nuclear Magnetic Resonance (NMR), and complex chromatographic profiles obtained during forced-degradation studies. Analytical results are presented through direct spectral overlays, aligned chromatographic traces, and side-by-side boxplots that illustrate distribution patterns, ranges, and median values. These visual representations allow analysts to identify meaningful differences in structural or physicochemical characteristics that may not be adequately captured by simple numerical comparisons.
Read more about forced degradation studies for biosimilars to understand how stress testing can reveal degradation pathways and support comparative stability assessments.
Methodological Challenges in Statistical Approaches to Analytical Similarity
Applying statistical approaches to analytical similarity involves several technical difficulties, particularly those associated with limited reference lot sample sizes, lot selection bias, and the inaccurate estimation of intra-lot and inter-lot variance. Addressing these challenges requires appropriate variance estimation models, careful reference lot selection, and scientifically justified risk-ranking tools to minimize the possibility of incorrectly concluding that two products are not similar.
Variance Estimation Bias and Lot Heterogeneity
Estimating the reference product variance (σR) can introduce bias when multiple samples from individual lots are analyzed without appropriately accounting for hierarchical variance components. When n > 1 test samples are collected from each of k reference lots, conventional variance calculations may combine inter-lot variability with intra-lot analytical variability, potentially producing an inaccurate estimate of the variation between lots.
As described in biostatistical literature, the total variance of an analytical measurement xRij, representing sample j from reference lot i, includes both the variance between lot means (σμ2) and the within-lot sample variance (σ2):
Var(xRij) = σμ2 + σ2
If biostatisticians interpret unadjusted sample standard deviations as reliable estimates of population parameters without considering the underlying variance structure, the resulting equivalence margin may become excessively dependent on the characteristics of the selected lots. Reference lots with unusually low variability can produce an overly restrictive margin (±1.5σR), potentially disadvantaging a biosimilar despite genuine analytical similarity. Conversely, including expired or improperly stored reference product lots may artificially increase the estimated value of σR, resulting in a wider acceptance margin and reduced sensitivity for detecting meaningful differences. Appropriate lot selection and variance modeling are therefore essential for generating scientifically defensible analytical similarity assessments.
Risk Assessment Ranking Tools for Attribute Classification
Risk assessment ranking tools provide a structured and scientifically justified basis for assigning individual quality attributes to Tier 1, Tier 2, or Tier 3 statistical evaluations. Sponsors may use Failure Modes and Effects Analysis (FMEA) or multi-criteria scoring matrices to systematically assess the potential clinical consequences of differences in each attribute.
- High Risk (Tier 1): These attributes are directly associated with clinical efficacy or primary biological activity. Examples include Fab-binding affinity, target cell apoptosis, and neutralization potency.
- Moderate Risk (Tier 2): These attributes may influence pharmacokinetics (PK), clearance, immunogenicity risk, or product stability. Examples include FcRn binding, afucosylation level, high molecular weight species/aggregates, and charge variants.
- Low Risk (Tier 3): These attributes generally have limited expected clinical impact or represent qualitative structural characteristics. Examples include C-terminal lysine cleavage, secondary/tertiary folding spectra, and raw peptide mapping profiles.
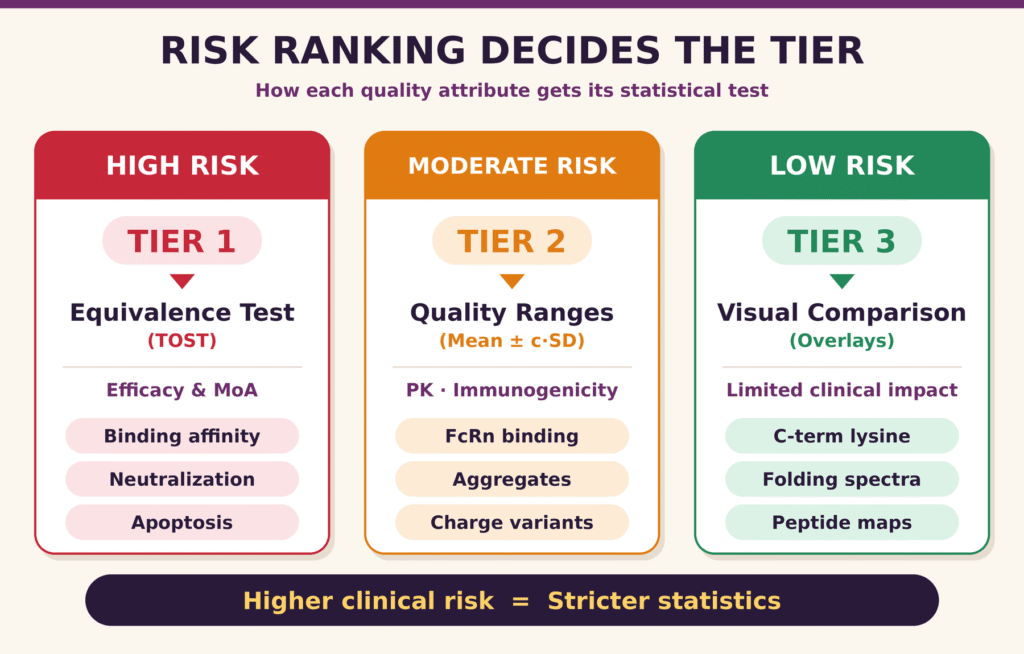
The classification of each attribute should be supported by scientific evidence, knowledge of the product’s mechanism of action, and an assessment of the potential consequences of observed differences. This risk-based approach helps ensure that the intensity of statistical evaluation remains proportionate to the clinical significance of each CQA.
Explore critical quality attributes in biosimilars to learn how product-specific risk assessments help prioritize analytical characterization.
Comparative Overview of Statistical Tiers in Analytical Similarity
A structured comparison of the three statistical tiers demonstrates how the rigor of analytical assessment is aligned with the clinical importance of individual attributes and the characteristics of the available data. The following table summarizes the statistical methods, acceptance criteria, and analytical applications associated with Tiers 1, 2, and 3.
| Statistical Tier | Attribute Clinical Risk Level | Primary Biostatistical Tool | Regulatory Limit / Acceptance Margin | Primary Analytical Method Applications |
|---|---|---|---|---|
| Tier 1: Equivalence Testing | Highest risk; associated with primary MoA and efficacy | Two One-Sided Tests (TOST), with α = 0.05 | The 90% confidence interval for the mean difference must fall within ±1.5 · σR under the historical framework | Cell-Based Potency Bioassays, Surface Plasmon Resonance (SPR), and Target Receptor Binding |
| Tier 2: Quality Ranges | Moderate-to-high risk; associated with PK, immunogenicity, and stability | Quality Range Interval (μR ± c · σR) | Approximately 90%-95% of biosimilar lot measurements are expected to fall within Mean ± (2 to 3) · SD, depending on the selected approach | Size-Exclusion Chromatography (SEC), Cation Exchange (CEX), and Glycan Profiling (NP-HPLC/LC-MS) |
| Tier 3: Visual Comparison | Lowest risk; primarily qualitative structural characteristics | Graphical Trace Overlays and Boxplots | Assessment based on visual agreement between overlays and the degree of overlap in observed distributions | NMR, Circular Dichroism (CD), FTIR, and Mass Spectrometry Peptide Mapping |
The selection of a statistical tier should be justified by the clinical relevance of the attribute, the characteristics of the analytical method, and the scientific objectives of the comparative analytical assessment. The acceptance criteria described above represent elements of the historical three-tiered framework and should not be interpreted as universally mandatory FDA requirements for every contemporary biosimilar submission. The appropriate methodology and acceptance criteria depend on the applicable regulatory guidance, the available reference product data, and the scientific justification provided by the sponsor.
How the FDA Judges the Totality of Analytical Evidence
The FDA assesses biosimilar applications through a comprehensive totality-of-the-evidence framework, in which analytical characterization provides the scientific foundation for determining whether additional clinical evaluations are necessary. Within this framework, an isolated statistical deviation in a particular quality attribute does not automatically establish that a proposed biosimilar is dissimilar. Its significance must be evaluated alongside orthogonal analytical findings, functional data, and the potential clinical consequences of the observed difference.
During the assessment of comparative analytical datasets, FDA reviewers examine structural and functional similarity while considering analytical method sensitivity, sample age, and the results of orthogonal characterization. An isolated statistical failure involving a Tier 1 or Tier 2 attribute may reflect assay variability or a non-critical manufacturing process difference rather than a meaningful biological difference. However, such a finding requires a scientifically supported investigation to determine its cause and potential impact.
Sponsors can strengthen their analytical similarity assessments by combining complementary techniques that evaluate the same quality attribute through different measurement principles. For example, Sedimentation Velocity Analytical Ultracentrifugation (SV-AUC) can be used alongside Size-Exclusion Chromatography with Multi-Angle Light Scattering (SEC-MALS) to provide complementary information about aggregation and molecular size distributions. Agreement between orthogonal methods can strengthen the interpretation of structural characterization results and help clarify apparent differences identified by individual assays. Establishing a convincing body of analytical evidence can support the scientific justification for reducing or streamlining comparative clinical efficacy studies when permitted by the applicable regulatory framework, potentially accelerating development and time-to-market.
Learn how peptide mapping in biosimilars supports primary-structure characterization and the investigation of molecular differences.
Conclusion: Master Strategy for Statistical Approaches to Analytical Similarity
The effective implementation of statistical approaches to analytical similarity requires biopharmaceutical developers to integrate advanced analytical testing with scientifically justified, risk-based statistical methodologies. By appropriately selecting equivalence testing, quality ranges, and visual comparison methods according to the clinical relevance of each CQA, sponsors can develop comprehensive regulatory submissions supported by robust analytical evidence.
As regulatory expectations continue to emphasize flexible, risk-informed comparative analytical assessment, biopharmaceutical companies must use high-precision characterization techniques and appropriate statistical models to evaluate product similarity. Careful consideration of lot-to-lot variability, hierarchical variance components, reference lot selection, and attribute risk ranking is essential for generating reliable and interpretable results. Collaborating with specialized analytical laboratories can help developers obtain the complementary testing data needed to characterize biological products, investigate observed differences, support regulatory review, and facilitate efficient clinical development.
Strengthen your biosimilar development strategy with an end-to-end biosimilar analytical package for regulatory submission from ResolveMass Laboratories.
For expert analytical characterization, statistical similarity assessment, and customized testing strategies, visit the ResolveMass Laboratories Contact Page.
Frequently Asked Questions
The FDA withdrew its 2017 draft guidance in June 2018 after concerns emerged about the statistical assumptions and practical limitations of the proposed three-tiered framework. In particular, estimating acceptance limits from a small number of reference product lots could produce unreliable margins and misleading conclusions. These issues highlighted the need for more flexible, scientifically justified comparative analytical assessments.
Tier 1 uses formal equivalence testing to assess whether differences between product means remain within predefined limits for attributes considered especially important to biological activity. Tier 2 compares individual biosimilar measurements with a range derived from reference product variability. The methods address different analytical questions, and their application depends on the scientific justification and relevant regulatory framework.
The FDA considers an individual statistical result within the broader body of analytical and functional evidence rather than interpreting it in isolation. Reviewers examine the magnitude and potential significance of the difference, the reliability of the analytical method, and findings from complementary tests. Sponsors must investigate unexpected results and provide a scientifically supported explanation of their possible impact on product quality and clinical performance.
Orthogonal methods examine a product characteristic using different analytical principles, helping researchers determine whether a finding reflects a genuine molecular difference or a method-specific limitation. For example, SV-AUC and SEC-MALS can provide complementary information about protein size distributions and aggregation. Interpreting these results together can improve confidence in the overall characterization of a biosimilar.
There is no single reference-lot count that applies to every biosimilar analytical assessment. The appropriate number depends on the regulatory expectations, the variability of the product, the attributes being evaluated, and the statistical strategy. Sponsors should justify their sampling plan to ensure that the reference dataset adequately represents relevant product variability.
In the historical Tier 2 framework, the multiplier (c) determines the width of a quality range around the reference product’s mean. A larger multiplier creates a wider interval, while a smaller multiplier produces a narrower one. Its selection should reflect the chosen statistical methodology, the available reference data, and the scientific objectives rather than being treated as a universally fixed value.
Yes, a statistical framework can sometimes indicate a failure when reference product lots are compared with one another, particularly if acceptance limits are estimated unreliably from a small or unrepresentative dataset. Differences in natural lot variability and the estimation of standard deviation can contribute to this outcome. Such findings illustrate why statistical assumptions and reference-lot selection must be carefully evaluated.
Risk ranking helps sponsors determine how intensively each critical quality attribute should be evaluated according to its potential impact on product safety, efficacy, and biological function. Attributes closely associated with biological activity may warrant rigorous quantitative comparisons, whereas other characteristics may be assessed using suitable quality ranges or graphical analyses. The selected approach should be supported by product-specific evidence and a documented scientific rationale.
Reference:
- U.S. Food and Drug Administration. (n.d.). Overview of the regulatory framework and FDA’s guidance for the development and approval of biosimilar and interchangeable products in the US. https://www.fda.gov/files/drugs/published/Overview-of-the-Regulatory-Framework-and-FDA%27s-Guidance-for-the-Developmet-and-Approval-of-Biosmiliar-and-Interchangeable-Products-in-the-US.pdf
- Chow, S.-C., Song, F., & Bai, H. (2016). Analytical similarity assessment in biosimilar studies. The AAPS Journal, 18(3), 670–677. https://doi.org/10.1208/s12248-016-9882-5
- U.S. Food and Drug Administration. (2017). Overview of the regulatory framework and FDA’s guidance for the development and approval of biosimilar products. https://www.fda.gov/media/105779/download
- U.S. Food and Drug Administration. (2026, May). Statistical approaches to establishing bioequivalence: Guidance for industry. Center for Drug Evaluation and Research. https://www.fda.gov/media/163638/download
- U.S. Food and Drug Administration. (2019). Statistical review(s): Biologics license application (BLA) 761081. https://www.accessdata.fda.gov/drugsatfda_docs/nda/2019/761081Orig1s000StatR.pdf
Get In Touch With Us
About The Author