
Released N-Glycan Profiling Service for Biosimilars: HILIC-FLD and 2-AB Labelling Approaches
 By Anusha Sinha
•
August 7, 2026
By Anusha Sinha
•
August 7, 2026
Introduction
A dedicated Released N-Glycan Profiling Service for Biosimilars delivers the high-resolution and quantitative characterization necessary to demonstrate structural equivalence between a biosimilar candidate and its innovator reference biologic. Within regulatory frameworks established by the US Food and Drug Administration (FDA) and the European Medicines Agency (EMA), accurate glycan comparability is considered a fundamental requirement for confirming comparable clinical safety, therapeutic efficacy, and pharmacokinetic performance.
Therapeutic monoclonal antibodies (mAbs) belonging to the IgG1 subclass possess a conserved N-glycosylation site at Asparagine 297 (Asn297), located within the CH2 domain of each Heavy Chain Fragment crystallizable (Fc) region. The oligosaccharides attached at this position exhibit structural microheterogeneity due to non-template-driven enzymatic processing occurring within host expression systems, including Chinese Hamster Ovary (CHO) cells and murine myeloma cell lines such as NS0 and Sp2/0. Although intact-protein or subunit-level mass spectrometry can provide valuable glycosylation information, these approaches may be affected by mass spectral deconvolution complexity and gas-phase ionization bias. Consequently, enzymatic release of N-glycans followed by fluorescent labeling and Hydrophilic Interaction Liquid Chromatography with Fluorescence Detection (HILIC-FLD) continues to serve as the recognized gold-standard technique for accurate relative glycan quantification. ResolveMass Laboratories Inc. employs sophisticated analytical workflows to perform these release-based characterizations while maintaining stringent quality and compliance standards.
Discover how our specialized Biosimilar Characterization Services can support your therapeutic development from initial host line setup through regulatory approval.
Need Accurate Released N-Glycan Profiling for Your Biosimilar Program?
ResolveMass offers released N-glycan profiling using validated HILIC-FLD workflows with 2-AB labeling to support glycan identification, relative quantification, lot-to-lot comparison, and biosimilar similarity assessments. Contact us
Article Summary Key Takeaways
- Released N-Glycan Profiling is a critical analytical service for biosimilars, providing high-resolution characterization of Fc N-glycans to demonstrate structural similarity with reference biologics and support FDA, EMA, and ICH Q6B regulatory requirements.
- 2-AB labeling combined with HILIC-FLD is the gold-standard workflow for released glycan analysis, offering accurate relative quantification, excellent reproducibility, and reliable comparison of glycan profiles across biosimilar and reference products.
- The analytical process includes protein denaturation, PNGase F enzymatic glycan release, 2-AB fluorescent labeling, solid-phase extraction (SPE) cleanup, and HILIC-FLD separation with Glucose Unit (GU) calibration for standardized glycan identification.
- Key glycan Critical Quality Attributes (CQAs)—including core fucosylation, galactosylation, high-mannose structures, sialylation, and non-human glycans—directly influence ADCC, CDC, pharmacokinetics, immunogenicity, and overall therapeutic performance.
- HILIC-FLD with GU calibration enables precise separation and identification of glycans by comparing retention data with reference databases such as GlycoBase, ensuring consistent and reproducible structural assignments.
- Although RapiFluor-MS and InstantPC provide faster labeling and higher MS sensitivity, 2-AB remains the preferred regulatory standard because of its extensive historical acceptance and compatibility with legacy biosimilar comparability studies.
- Statistical comparability testing using multiple reference product lots, quality ranges, equivalence testing, and glycosimilarity indices ensures biosimilar glycan profiles remain within acceptable limits, supporting regulatory approval and consistent manufacturing quality.
Regulatory Framework and Critical Quality Attribute Mapping for Released N-Glycan Profiling Service for Biosimilars
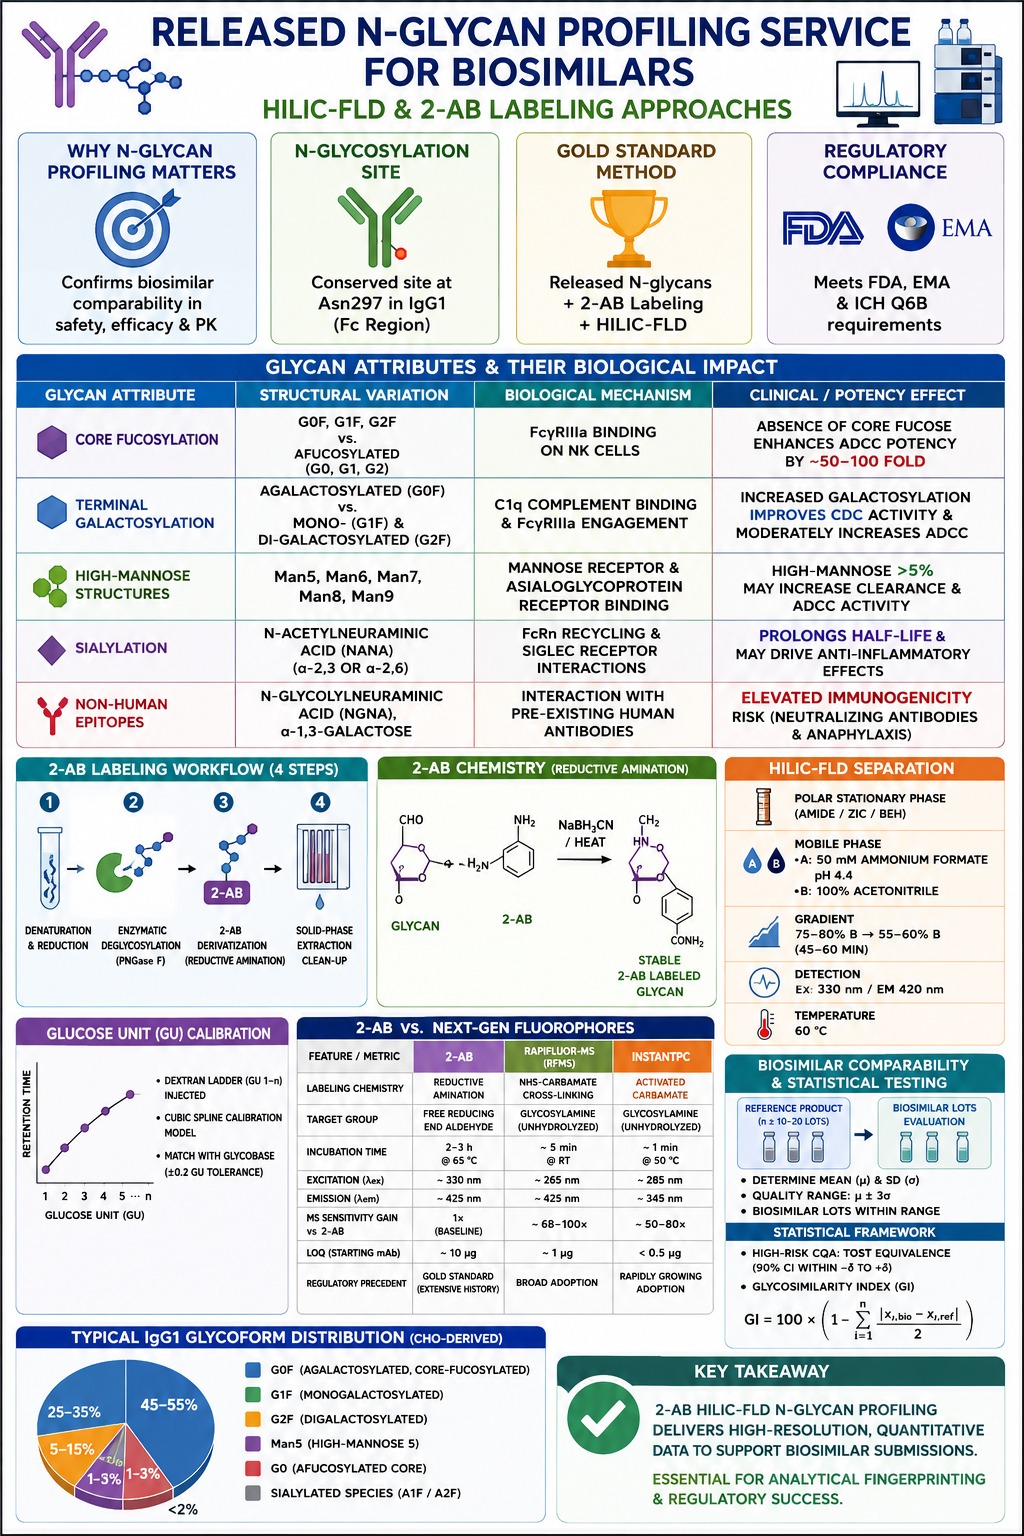
Guidelines outlined in ICH Q6B require comprehensive identification and quantitative assessment of post-translational modifications, recognizing specific N-glycan structures as Critical Quality Attributes (CQAs) because of their direct influence on therapeutic performance. Since N-glycosylation plays a central role in antibody effector functions, including Antibody-Dependent Cellular Cytotoxicity (ADCC) and Complement-Dependent Cytotoxicity (CDC), even subtle shifts in glycoform distribution may lead to measurable changes in biological activity, potency, and safety.
Read our guide on navigating the ICH Q6B Guidelines for Biological Characterisation to ensure complete compliance across all critical quality metrics.
The FDA’s 351(k) biosimilar pathway places significant emphasis on an analytical fingerprinting strategy, where extensive physicochemical characterization serves as the cornerstone of the biosimilarity assessment package. In parallel, EMA guidance requires manufacturers to demonstrate that glycan distributions remain within predefined equivalence ranges established through the evaluation of multiple lots of the reference medicinal product.
Learn how to identify and control your biologic’s Critical Quality Attributes (CQAs) in Biosimilars to build a robust analytical fingerprint.
| Glycan Attribute Category | Primary Structural Variations | Target Biological Mechanism | Clinical & Potency Effect |
|---|---|---|---|
| Core Fucosylation | G0F, G1F, G2F vs. Afucosylated (G0, G1, G2) | FcγRIIIa binding affinity on Natural Killer (NK) cells | Absence of core fucose can enhance ADCC potency by approximately 50- to 100-fold. |
| Terminal Galactosylation | Agalactosylated (G0F) vs. Mono- (G1F) and Di-galactosylated (G2F) | C1q complement complex binding and FcγRIIIa engagement | Increased galactosylation improves CDC activity and can moderately increase ADCC. |
| High-Mannose Structures | Man5, Man6, Man7, Man8, Man9 | Mannose Receptor & Asialoglycoprotein Receptor binding | Elevated high-mannose content (>5%) may accelerate systemic clearance while increasing ADCC activity. |
| Sialylation | N-Acetylneuraminic acid (NANA) via α-2,3 or α-2,6 linkages | FcRn recycling and siglec receptor interactions | Can prolong circulating half-life, while elevated terminal sialylation may contribute to anti-inflammatory effects. |
| Non-Human Epitopes | N-Glycolylneuraminic acid (NGNA), α-1,3-galactose | Interaction with pre-existing circulating human antibodies | Associated with elevated immunogenicity risk, including neutralizing antibody responses and potential anaphylactic reactions. |
Swipe horizontally to view the full table on smaller screens.
Technical Architecture of the 2-AB Labelling Workflow
The 2-aminobenzamide (2-AB) labeling workflow involves enzymatic release of N-glycans from the protein backbone followed by attachment of a fluorescent tag through reductive amination at a 1:1 stoichiometric ratio. This multistep preparation process converts naturally non-chromophoric carbohydrate structures into fluorescent analytes that are suitable for highly sensitive optical detection and quantitative analysis.
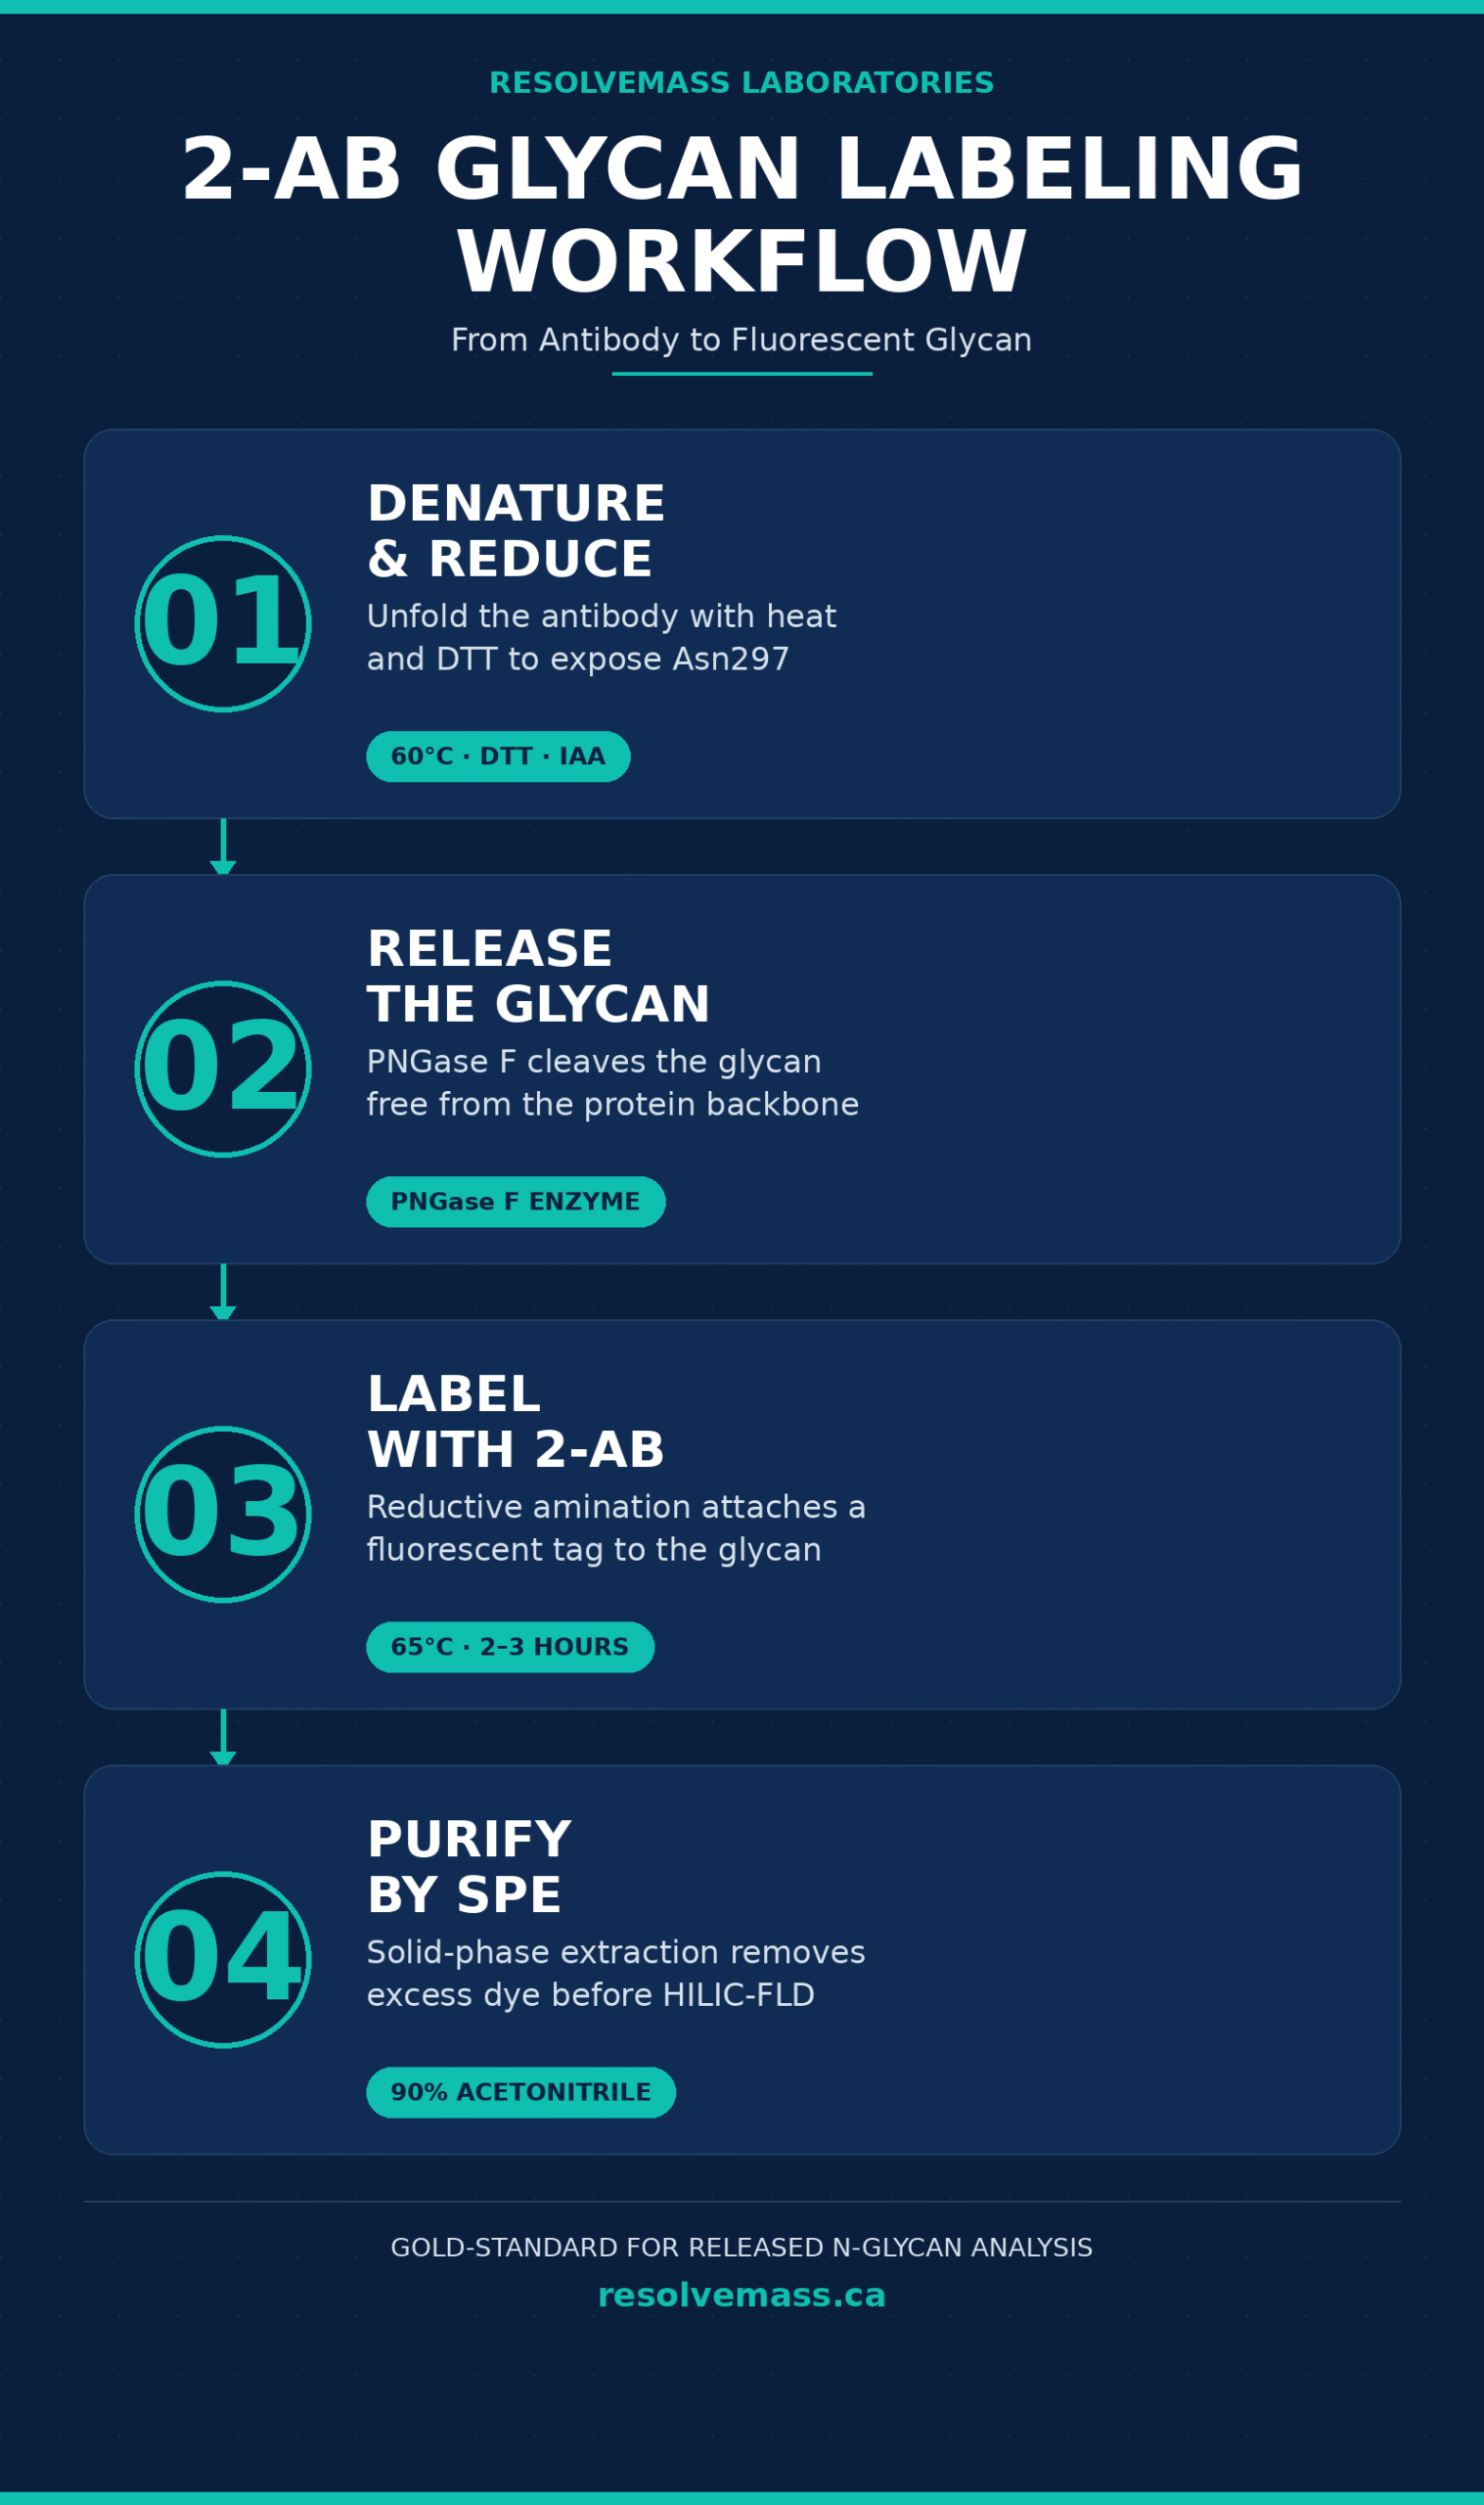
The analytical workflow advances through four distinct operational stages: protein denaturation and reduction, enzymatic deglycosylation, chemical derivatization, and solid-phase extraction clean-up. Initially, the glycoprotein is denatured and reduced to expose glycosylation sites that are otherwise sterically inaccessible. Subsequently, PNGase F releases the N-glycans, generating free glycans and a deglycosylated protein backbone. The liberated glycans are then subjected to 2-AB reductive amination, producing stable fluorescent derivatives. In the final stage, solid-phase extraction removes excess labeling reagents and impurities, resulting in purified labeled glycans suitable for HILIC-FLD analysis.
Learn how our specialized Post-Translational Modifications (PTMs) in Biosimilars workflows systematically isolate and characterize modifications across your lead candidates.
Denaturation, Reduction, and Enzymatic Deglycosylation via PNGase F
Successful enzymatic deglycosylation depends on complete unfolding of the protein structure so that the endoglycosidase can efficiently access the glycosylation site at Asn297. Monoclonal antibodies are typically treated with surfactants such as RapiGest SF or sodium dodecyl sulfate (SDS), combined with controlled thermal denaturation. Disulfide bonds are then reduced using dithiothreitol (DTT) at 60°C for 30 minutes. This is followed by alkylation of exposed cysteine residues with iodoacetamide (IAA) under light-protected conditions to minimize re-oxidation and aggregation during subsequent analytical processing.
Peptide-N-glycosidase F (PNGase F) is widely recognized as the standard endoglycosidase for cleaving the β-aspartylglycosylamine bond that connects the innermost N-acetylglucosamine (GlcNAc) residue to the asparagine side chain. This enzymatic process generates a transient glycosylamine intermediate while converting the original asparagine residue into aspartic acid. Under mildly acidic or neutral buffer conditions, the glycosylamine intermediate undergoes spontaneous hydrolysis, yielding a free reducing glycan that exists in equilibrium with its open-ring aldehyde form.
2-AB Derivatization Chemistry and Solid-Phase Extraction
2-AB derivatization is performed through a reductive amination reaction that attaches a single fluorophore to the reducing terminus of each released glycan. During this reaction, the primary amino group of 2-aminobenzamide nucleophilically attacks the carbonyl carbon of the glycan’s open-ring aldehyde form, creating a reversible Schiff base intermediate. The subsequent addition of a mild reducing agent, such as sodium cyanoborohydride (NaBH₃CN) or picoline borane, converts the imine into a stable secondary amine linkage through reduction. Typical reaction conditions involve incubation at 65°C for 2 to 3 hours in a solvent system consisting of 30% glacial acetic acid in dimethyl sulfoxide (DMSO).
After the labeling reaction is completed, excess 2-AB reagent and reducing agents must be efficiently removed to prevent detector saturation and chromatographic stationary-phase contamination. Solid-Phase Extraction (SPE) using amide-functionalized micro-elution plates or Hydrophilic Interaction SPE materials selectively retains the highly polar 2-AB-labeled glycans under high-organic solvent conditions, such as 90% acetonitrile. Nonpolar dye molecules and residual reagents are washed away during the purification process. The purified fluorescent glycans are then eluted using water or aqueous ammonium formate buffer and prepared for chromatographic analysis.
HILIC-FLD Separation Mechanics and Glucose Unit Calibration
Hydrophilic Interaction Liquid Chromatography coupled with Fluorescence Detection (HILIC-FLD) separates released glycans according to their interactions with a polar stationary phase and employs Glucose Unit (GU) calibration using a dextran ladder to provide highly reproducible retention-time assignment. The chromatographic mechanism relies on analyte partitioning into an aqueous-rich layer adsorbed onto the stationary phase surface, enabling effective resolution of structurally related glycan species.
Chromatographic Separation Parameters and Elution Profiles
Effective chromatographic resolution of complex N-glycan mixtures depends on advanced stationary phase technologies, including sub-2 μm or highly porous amide-bonded silica particles, ethylene-bridged hybrid (BEH) materials, and zwitterionic (ZIC) stationary phases. Mobile Phase A generally consists of an aqueous buffer, commonly 50 mM ammonium formate adjusted to pH 4.4, which provides adequate ionic strength while minimizing undesirable ionic interactions. Mobile Phase B is composed of 100% HPLC-grade acetonitrile.
The chromatographic gradient typically begins at a high organic composition, approximately 75%–80% Mobile Phase B, and gradually transitions toward a more aqueous environment, reaching approximately 55%–60% Mobile Phase B over a runtime of 45 to 60 minutes. Smaller neutral glycans generally elute earlier in the chromatographic run, whereas larger, highly branched, and heavily sialylated glycans exhibit longer retention due to increased hydrogen-bonding interactions with the stationary phase. Column temperatures are commonly maintained at 60°C to lower solvent viscosity, improve mass transfer efficiency, and preserve optimal peak symmetry. For detection of 2-AB-labeled glycans, fluorescence settings are typically configured with an excitation wavelength (λₑₓ) of 330 nm and an emission wavelength (λₑₘ) of 420 nm.
Glucose Unit Calibration and Database Matching
Glucose Unit (GU) calibration transforms raw chromatographic retention times into standardized numerical values by analyzing an external dextran ladder hydrolysate under the same chromatographic conditions used for sample analysis. This normalization process minimizes retention time variability arising from environmental temperature fluctuations, slight differences in mobile phase preparation, or gradual column aging.
A fluorescently labeled dextran ladder, consisting of glucose oligomers connected through α-1,6 glycosidic linkages, is injected before or alongside the analytical sequence. A cubic spline calibration model is generated by plotting the observed retention times of individual dextran ladder peaks against their known degree of polymerization (GU = 1, 2, 3, …, n). The retention time (tR) of each unknown glycan peak is then projected onto this calibration curve to determine its experimental GU value. These experimentally derived GU values are subsequently compared against established glycan reference libraries, such as GlycoBase, using a narrow matching tolerance of ±0.2 GU to support accurate structural assignment.
Explore our specialized solutions for Glycosylation Analysis of Biosimilars to ensure precise glycoform fingerprinting and lot-to-lot consistency.
Comparative Analysis: 2-AB vs. Next-Generation Fluorophores in Released N-Glycan Profiling Service for Biosimilars
Selection of an appropriate fluorophore platform for a Released N-Glycan Profiling Service for Biosimilars requires careful consideration of regulatory acceptance, analytical sensitivity, and operational efficiency. While 2-AB labeling remains deeply established within historical regulatory submissions and comparability studies, newer fluorophore technologies have been developed to improve throughput and enhance mass spectrometric performance.
| Feature / Metric | 2-Aminobenzamide (2-AB) | RapiFluor-MS (RFMS) | InstantPC |
|---|---|---|---|
| Labeling Reaction Chemistry | Reductive amination (Schiff base reduction) | NHS-carbamate rapid cross-linking | Activated carbamate reaction |
| Target Functional Group | Free reducing end aldehyde | Unhydrolyzed glycosylamine intermediate | Unhydrolyzed glycosylamine intermediate |
| Incubation Time & Temperature | 2–3 hours at 65°C | Approximately 5 minutes at room temperature | Approximately 1 minute at 50°C |
| Fluorescence Excitation (λₑₓ) | Approximately 330 nm | Approximately 265 nm | Approximately 285 nm |
| Fluorescence Emission (λₑₘ) | Approximately 425 nm | Approximately 425 nm | Approximately 345 nm |
| MS Sensitivity Gain Compared with 2-AB | Baseline (1×) | Approximately 68–100× increase | Approximately 50–80× increase |
| Assay Limit of Quantitation (LOQ) | Approximately 10 μg starting mAb protein | Approximately 1 μg starting mAb protein | Less than 0.5 μg starting mAb protein |
| Regulatory Precedent | Gold standard with extensive compendial history | Broad commercial and regulatory adoption | Rapidly growing industry adoption |
Swipe horizontally to view the full table on smaller screens.
Although RapiFluor-MS and InstantPC provide significant advantages for high-throughput screening during clone selection, cell line development, and bioprocess optimization, 2-AB continues to play a critical role in regulatory comparability programs. When legacy biosimilar development packages are based on historical 2-AB datasets, continued use of 2-AB HILIC-FLD methodologies enables direct analytical comparability and minimizes the need for extensive cross-platform bridging and re-validation studies.
Biosimilar Comparability Assessment and Statistical Equivalence Testing
Establishing biosimilar comparability requires demonstrating statistical equivalence for individual N-glycan species across multiple batches of both the innovator reference product and the biosimilar candidate. Comprehensive quantification of major, minor, and trace glycoforms accounts for inherent manufacturing variability within the reference product while simultaneously verifying process consistency across biosimilar production lots.
Discover our end-to-end framework for executing a seamless Comparability Exercise in Biosimilar Development.
The comparability assessment follows a systematic workflow. Multiple batches of the innovator reference product (n ≥ 10–20) are analyzed to determine the target mean (μ) and standard deviation (σ). These values are subsequently used to establish Quality Ranges (μ ± 3σ) and formal equivalence limits. Biosimilar manufacturing lots are then assessed against these predefined ranges to verify structural similarity and process reproducibility.
Read about our multi-attribute characterization strategies for Biosimilar Comparability Studies to safeguard your filing.
Statistical Evaluation Frameworks
Acceptance criteria for major non-critical quality attributes are typically established through analysis of 10 to 20 independent lots of the reference medicinal product. The resulting Quality Range (μ ± 3σ) serves as the benchmark for evaluating biosimilar production batches. Each biosimilar lot is expected to fall within this statistically derived range.
For high-risk Critical Quality Attributes with well-established biological relevance, such as afucosylated glycan content (G0 + G0F-GlcNAc), a Two One-Sided Tests (TOST) statistical equivalence approach is commonly applied. Under this framework, the 90% confidence interval for the difference between the biosimilar candidate and the reference product must remain entirely within predefined equivalence boundaries (−δ, +δ).
To assess global similarity across complex glycan profiles containing numerous chromatographic peaks, a Glycosimilarity Index (GI) can be calculated according to the following equation:
where (x_i) represents the normalized relative peak-area percentage for glycan species (i) across the total number of identified peaks ((n)).
Representative Glycoform Distributions in IgG1 Biosimilars
A typical CHO-derived recombinant IgG1 monoclonal antibody, including products such as Adalimumab, Infliximab, or Trastuzumab, generally exhibits a characteristic glycan distribution dominated by neutral complex biantennary structures:
- G0F (Agalactosylated, core-fucosylated): 40%–55%
- G1F (Monogalactosylated isomers, G1F[a] and G1F[b]): 25%–35%
- G2F (Digalactosylated, core-fucosylated): 5%–15%
- Man5 (High-mannose 5): 1%–5%
- G0 (Afucosylated core): 1%–3%
- Sialylated Species (A1F / A2F): Less than 2%
These glycoform distributions provide important benchmarks for biosimilar comparability assessments and support evaluation of manufacturing consistency throughout product development and lifecycle management.
Conclusion
A comprehensive Released N-Glycan Profiling Service for Biosimilars utilizing 2-AB labeling in combination with HILIC-FLD analysis delivers the structural resolution and quantitative accuracy necessary to support biosimilar regulatory submissions. The integration of robust derivatization chemistry with standardized Glucose Unit calibration enables reliable identification, characterization, and monitoring of Critical Quality Attributes throughout the development process.
As global regulatory agencies continue to place increased emphasis on analytical fingerprinting as the primary foundation for biosimilarity assessment, released glycan profiling remains an essential component of successful biosimilar development strategies and regulatory approval pathways.
Ensure complete coverage by reading our overview on Charge Variant Analysis in Biosimilars: Mass Spectrometry Approaches for Heterogeneity.
To learn more about analytical testing capabilities or to discuss customized biosimilar comparability study designs, contact the technical team through the ResolveMass Contact Us page.
Frequently Asked Questions
Why is core afucosylation considered an important Critical Quality Attribute (CQA)?
Core afucosylation has a direct impact on the interaction between the antibody Fc region and FcγRIIIa receptors located on Natural Killer (NK) cells. Variations in afucosylated glycan levels can substantially influence Antibody-Dependent Cellular Cytotoxicity (ADCC) activity, which may affect the therapeutic performance of the product. For this reason, regulatory agencies closely evaluate afucosylation during biosimilar comparability assessments.
How are Glucose Unit (GU) values generated in HILIC-FLD analysis?
GU values are obtained by analyzing a fluorescently labeled dextran ladder under the same chromatographic conditions used for sample testing. The retention times of the dextran oligomers are used to build a calibration curve, allowing unknown glycan peaks to be assigned standardized GU values. This approach improves consistency between analytical runs and supports accurate glycan identification through database matching.
What are the key differences between 2-AB labeling and RapiFluor-MS labeling?
2-AB labeling relies on a reductive amination reaction that generally requires several hours to complete, whereas RapiFluor-MS labeling can be performed within minutes. In addition to faster sample preparation, RapiFluor-MS offers significantly enhanced mass spectrometry sensitivity. However, 2-AB remains widely accepted because of its extensive historical use in regulatory submissions and biosimilar comparability studies.
Why does 2-AB labeling continue to be used in regulatory biosimilar programs?
Despite the availability of newer labeling technologies, 2-AB remains a preferred approach because it has been extensively utilized in regulatory filings and established analytical methods for many years. Its long history provides a strong foundation for comparing new biosimilar data with existing reference datasets. This continuity can simplify analytical bridging and reduce the need for extensive method re-validation.
How does terminal galactosylation affect monoclonal antibody function?
Terminal galactose residues can influence the biological activity of monoclonal antibodies by modifying interactions within the Fc region. Increased galactosylation is often associated with improved binding to complement proteins, particularly C1q, which can enhance Complement-Dependent Cytotoxicity (CDC). Changes in galactosylation may also have a secondary effect on other immune-mediated mechanisms.
What causes elevated levels of high-mannose glycans during manufacturing?
High-mannose glycans can accumulate when glycan-processing enzymes within the Golgi apparatus do not completely convert precursor carbohydrate structures into mature complex glycans. Manufacturing variables such as cell culture conditions, harvest timing, nutrient availability, and bioreactor performance can all influence this process. Elevated high-mannose content may affect pharmacokinetics by increasing the rate of systemic clearance.
Why are non-human glycans such as NGNA and α-1,3-galactose closely monitored?
NGNA and α-1,3-galactose are carbohydrate structures that are not naturally produced in humans but may be generated by certain mammalian expression systems. Because humans can possess pre-existing antibodies against these epitopes, their presence on therapeutic proteins may increase the risk of unwanted immune responses. Monitoring and controlling these glycans is therefore important for ensuring product safety and minimizing immunogenicity concerns.
How much sample is typically required for a 2-AB HILIC-FLD glycan analysis?
A typical 2-AB HILIC-FLD assay generally requires approximately 10 to 50 micrograms of purified monoclonal antibody for each analytical replicate. This amount ensures sufficient material is available throughout the workflow, including denaturation, enzymatic glycan release, fluorescent labeling, purification, and chromatographic analysis. Sample requirements may vary depending on assay sensitivity and project objectives.
How are statistical equivalence limits established for biosimilar glycan profiles?
Statistical equivalence limits are determined by evaluating multiple batches of the reference product to understand the natural variability of individual glycan species. The resulting dataset is used to define acceptable ranges for biosimilar comparison. For glycan attributes with known biological significance, more rigorous statistical approaches such as Two One-Sided Tests (TOST) may be applied to demonstrate equivalence with a high level of confidence.
Reference:
- Duivelshof, B. L., Denorme, S., Sandra, K., Liu, X., Beck, A., Lauber, M. A., Guillarme, D., & D’Atri, V. (2021). Quantitative N-glycan profiling of therapeutic monoclonal antibodies performed by middle-up level HILIC-HRMS analysis. Pharmaceutics, 13(11), 1744. https://doi.org/10.3390/pharmaceutics13111744
- Szekrenyes, A., Szigeti, M., Dvorakova, V., Jarvas, G., & Guttman, A. (2020). Quantitative comparison of the N-glycosylation of therapeutic glycoproteins using the Glycosimilarity Index: A tutorial. TrAC Trends in Analytical Chemistry, 122, 115728. https://doi.org/10.1016/j.trac.2019.115728
- Reusch, D., & Tejada, M. L. (2023). Fc glycans of therapeutic antibodies as critical quality attributes. Glycobiology, 33(2), 80–97. https://doi.org/10.1093/glycob/cwac072
- Reiding, K. R., Bondt, A., Hennig, R., Gardner, R. A., O’Flaherty, R., Trbojević-Akmačić, I., Shubhakar, A., Hazes, J. M. W., Reichl, U., Fernandes, D. L., Pučić-Baković, M., Rapp, E., Spencer, D. I. R., Dolhain, R. J. E. M., Rudd, P. M., Lauc, G., & Wuhrer, M. (2019). High-throughput serum N-glycomics: Method comparison and application to study rheumatoid arthritis and pregnancy-associated changes. Molecular & Cellular Proteomics, 18(1), 3–15. https://doi.org/10.1074/mcp.RA117.000454
- Barbosa, M. D. F. S. (2011). Immunogenicity of biotherapeutics in the context of developing biosimilars and biobetters. Drug Discovery Today, 16(7–8), 345–353. https://doi.org/10.1016/j.drudis.2011.01.011
- Wang, H., Wu, L., Wang, C., Xu, J., Yin, H., Guo, H., Zheng, L., Shao, H., & Chen, G. (2021). Biosimilar or not: Physicochemical and biological characterization of MabThera and its two biosimilar candidates. ACS Pharmacology & Translational Science, 4(2), 790–801. https://doi.org/10.1021/acsptsci.0c00225
Need Accurate Released N-Glycan Profiling for Your Biosimilar Program?
ResolveMass offers released N-glycan profiling using validated HILIC-FLD workflows with 2-AB labeling to support glycan identification, relative quantification, lot-to-lot comparison, and biosimilar similarity assessments.
Contact usAbout The Author
Anusha Sinha
Anusha Sinha, B.Pharm, is an experienced pharma professional with a strong background in Analytical Chemistry and Polymer Chemistry. With a passion for translating complex scientific data into clear, accessible content, she plays a vital role in communicating ResolveMass Laboratories Inc.’s advanced testing capabilities. In addition to her scientific expertise, Anusha leads Business Development initiatives, helping clients across pharmaceutical, biotechnology, and materials science sectors find tailored analytical solutions. Her combined experience in science and strategy positions her at the forefront of client engagement and technical communication.