
Introduction
When a drug product is transferred to a new contract facility, executing an Analytical Method Transfer and Re-Validation ensures that testing procedures remain compliant, reliable, and regulatorily acceptable across different laboratory environments. When a sponsor transitions away from an outgoing Contract Development and Manufacturing Organization (CDMO), designated as the Sending Unit (SU), and engages a new contract facility as the Receiving Unit (RU), critical release and stability testing procedures must be systematically established to prevent batch release delays. This case study examines the strategic execution, resolution of technical gaps, and re-validation methodology required during a high-stakes CDMO transition. It highlights how ResolveMass Laboratories Inc. established analytical equivalence in accordance with the updated ICH Q2(R2) and ICH Q14 standards.
Transitions between contract facilities present technical challenges arising from differences in instrument architecture, software environments, analyst techniques, and site-specific laboratory practices. Without a structured methodology, variations between laboratories can lead to out-of-specification (OOS) investigations, retention time shifts, or compromised peak resolution during commercial lot testing. Implementing a formal technology transfer alongside phase-appropriate re-validation ensures that the analytical control strategy remains robust throughout the pharmaceutical product lifecycle.
Discover the fundamentals of analytical development for generic drugs and their role in maintaining reliable pharmaceutical testing.
Share via:
Quick Summary:
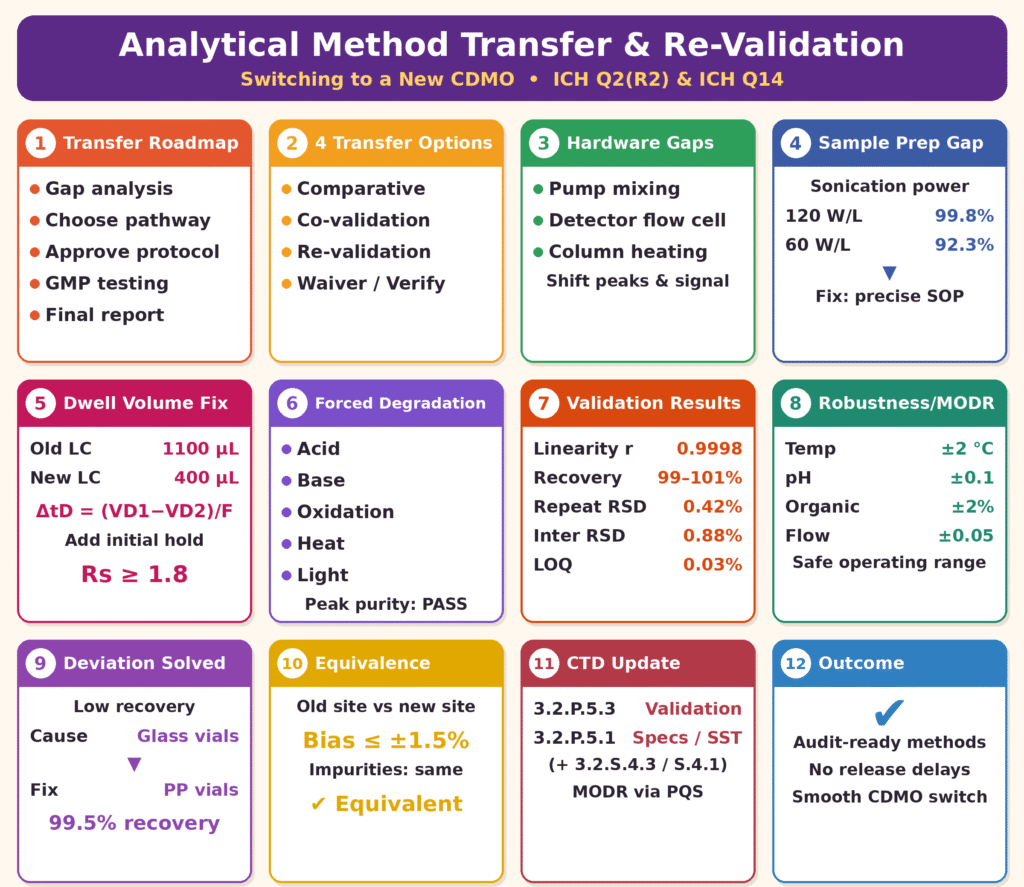
- Purpose: When a drug moves from an old CDMO (sending unit) to a new one (receiving unit), the testing methods must be transferred and re-validated. This keeps them compliant and reliable and avoids batch release delays.
- Choosing a pathway: A risk-based framework (gap analysis, pathway, protocol, execution, report) decides between comparative testing, co-validation, re-validation, or a waiver/verification. Re-validation is preferred when the old CDMO’s validation data is incomplete or unavailable.
- Pre-transfer gap analysis: Differences in pump design, detector flow cells and column heating can shift results. Undocumented “tacit knowledge” can also cause problems, such as sonication power: 120 W/L gave 99.8% recovery, while 60 W/L gave only 92.3%.
- Dwell volume fix: Moving a gradient method from a high-dwell system (~1100 µL) to a low-dwell one (~400 µL) can cause early elution and co-elution. Adding an initial hold time, ΔtD = (VD1 − VD2)/F, restores resolution (Rs ≥ 1.8).
- Re-validation under ICH Q2(R2)/Q14: Forced degradation confirmed specificity. All parameters met their criteria: linearity r = 0.9998, recovery 99.2–101.1%, repeatability RSD 0.42%, intermediate precision RSD 0.88%, LOQ 0.03%. Robustness testing defined a Method Operable Design Range (MODR).
- Deviation and equivalence: Low degradant recovery was traced to adsorption on glass vials, and switching to polypropylene vials restored 99.5% recovery. The statistical comparison showed assay bias within ±1.5% and no significant difference in impurities, so the transfer was confirmed.
- Regulatory and lifecycle control: CTD Module 3 sections 3.2.S.4.3/3.2.P.5.3 (validation) and 3.2.S.4.1/3.2.P.5.1 (specifications/SST) are updated. Adjustments within the MODR can then be managed through the quality system, which reduces future regulatory submissions.
Strategic Framework for Analytical Method Transfer and Re-Validation
A strategic framework for Analytical Method Transfer and Re-Validation provides a risk-based roadmap for determining whether comparative testing, co-validation, or partial-to-full re-validation is necessary under international regulatory guidelines. Selecting the appropriate pathway depends on method complexity, the quality and completeness of historical validation data, and the degree of hardware alignment between the sending and receiving facilities.
The technology transfer lifecycle progresses through structured decision gates to establish regulatory compliance and operational readiness:
- Risk Assessment and Gap Analysis: Reviewing historical validation packages, instrument configurations, and procedural SOPs to identify operational discrepancies and potential technical risks.
- Method Alignment Pathway: Selecting comparative execution, co-validation, or independent re-validation according to the severity and nature of the identified technical gaps.
- Protocol Development: Establishing pre-approved acceptance criteria, sampling plans, and statistical models before laboratory testing begins.
- Experimental Execution: Conducting comparative runs or re-validation studies under Good Manufacturing Practice (GMP) conditions.
- Data Harmonization and Reporting: Consolidating analytical results, investigating deviations, and preparing the final transfer report for regulatory filing.
The four recognized transfer mechanisms described in USP guidance and international lifecycle guidelines offer distinct strategic advantages depending on the program’s requirements and circumstances.
| Transfer Modality | Technical Scope and Regulatory Context | Primary Application | Required Deliverables |
|---|---|---|---|
| Comparative Testing | Inter-laboratory testing of identical, homogeneous sample lots by both the SU and RU under a pre-approved transfer protocol. | Established methods transferred between sites with highly similar instrument configurations. | Pre-approved transfer protocol, comparative dataset, statistical equivalence evaluation, and transfer report. |
| Co-Validation | The RU participates directly in the initial validation protocol alongside the SU, establishing intermediate precision across sites. | Fast-track development programs in which method validation and site onboarding occur simultaneously. | Integrated multi-site validation protocol, combined intermediate precision data, and validation report. |
| Re-Validation | Partial or full experimental execution of validation parameters at the RU in accordance with ICH Q2(R2) when significant method or equipment changes occur. | CDMO transitions involving missing SU validation data, modified instrument platforms, or altered operational parameters. | Gap assessment, full or partial re-validation protocol, system suitability metrics, and executed validation report. |
| Transfer Waiver / Verification | Formal risk-based justification for waiving comparative testing, relying instead on compendial verification under applicable USP guidance. | Standard compendial procedures, such as USP Water Determination, performed using qualified instruments. | Risk assessment report, compendial verification protocol, and instrument qualification package. |
When sponsors transition between facilities under compressed commercial timelines, complete historical validation packages from the outgoing CDMO are often incomplete, unverified, or proprietary. Under these circumstances, an independent re-validation strategy at the receiving facility provides a strong, audit-ready foundation for demonstrating analytical method suitability and supporting regulatory filings.
Understand how CDMOs and CROs differ in generic drug development when selecting the right technical partner.
Conducting Pre-Transfer Gap Analysis and Equipment Alignment
A pre-transfer gap analysis reduces operational risks by comparing hardware specifications, column thermodynamics, and sample preparation requirements between the sending and receiving sites before laboratory execution. This proactive assessment identifies subtle technical differences that could otherwise lead to experimental failures during formal testing.
Instrument Hardware and Optical Architecture Differences
Liquid chromatography (LC) and gas chromatography (GC) performance can be highly sensitive to instrument hardware design. Differences in pump delivery mechanisms, optical flow cell dimensions, and thermal management systems can directly affect chromatographic resolution, peak baseline stability, and the limit of detection.
A comparative assessment of high-performance liquid chromatography (HPLC) systems across contract facilities reveals several common hardware differences that require evaluation and, where necessary, normalization:
- Pump Fluidics: Low-pressure quaternary mixing systems generally exhibit larger gradient delay profiles than high-pressure binary mixing pumps. These differences can influence gradient delivery and chromatographic retention behavior.
- Detector Flow Cells: Standard 10 mm analytical flow cells can produce different band-broadening characteristics from low-dispersion 8 µL capillary flow cells. These differences can alter signal-to-noise (S/N) ratios when measuring trace impurities.
- Thermal Control Units: Forced-air convection column compartments transfer heat differently from direct-contact heat exchangers. These differences can shift retention times, particularly for temperature-sensitive compounds.
Review regulatory support for generic drugs in the US and Canada to understand the documentation needed for compliant development.
Sample Preparation Dynamics and Tacit Knowledge Gaps
Ambiguities in standard operating procedures (SOPs) can leave out subtle, technique-dependent factors, commonly referred to as tacit knowledge, that influence sample extraction efficiency. For example, an SOP instruction stating “extract via sonication for 15 minutes” can produce substantially different results depending on the equipment and operating conditions used.
If the outgoing CDMO uses a high-output ultrasonic bath operating at a power density of 120 W/L, complete sample dissolution and 99.8% analyte recovery might routinely be achieved. However, if the receiving laboratory performs the same procedure using a standard benchtop sonic bath with an output of 60 W/L, incomplete dissolution could reduce recovery to 92.3%, potentially triggering an out-of-specification investigation.
To address these operational differences, the receiving site should conduct pre-transfer trial runs using reference standards and spiked drug matrices. Establishing precise vortexing parameters, sonication power densities, and filtration media specifications in the updated SOP helps maintain method robustness and reproducibility across facilities.
See how a CDMO can accelerate generic drug development through coordinated analytical and manufacturing activities.
Technical Challenges in Analytical Method Transfer and Re-Validation: Resolving Dwell Volume Mismatches
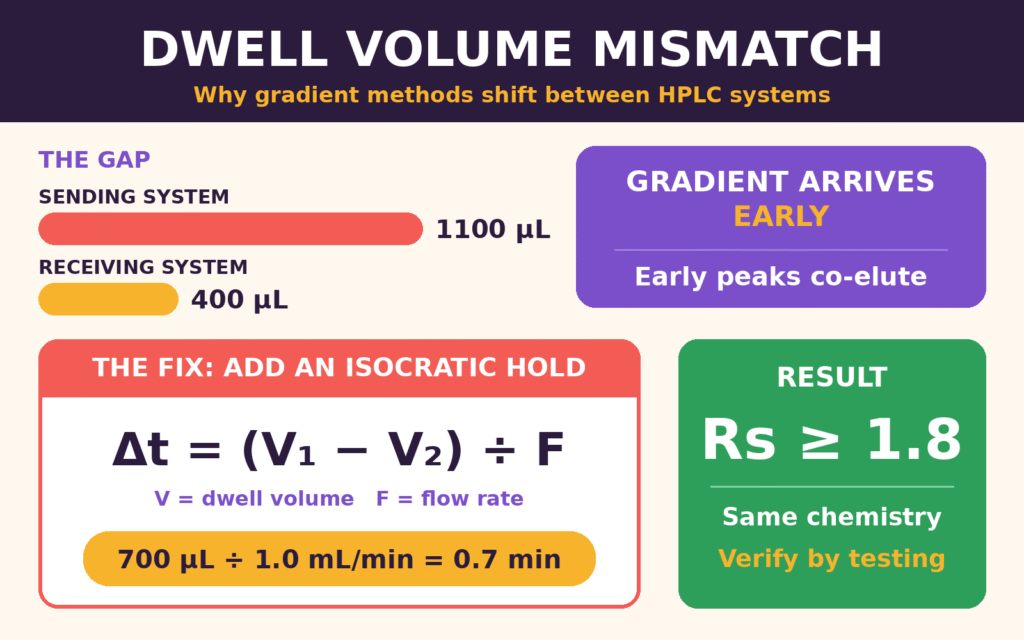
Resolving dwell volume mismatches during Analytical Method Transfer and Re-Validation helps prevent peak co-elution and chromatographic retention time shifts when gradient methods are transferred between different liquid chromatography systems. Dwell volume (VD) is defined as the fluidic volume between the point where the mobile phases are mixed and the inlet of the column.
Quantifying the Dwell Volume Impact
When a gradient HPLC separation is transferred from a high-dwell-volume system (VD1 ≈ 1100 µL) to a low-dwell-volume system (VD2 ≈ 400 µL), the organic solvent gradient reaches the column inlet considerably sooner on the receiving instrument. For early-eluting polar degradation products, this earlier gradient arrival can reduce retention on the stationary phase, causing peaks to elute close to the solvent front or co-elute with adjacent active pharmaceutical ingredient (API) peaks.
To align chromatographic behavior between instruments, analysts calculate the required gradient hold time adjustment (ΔtD) using the operational flow rate (F):
ΔtD = (VD1 − VD2) / F
Introducing an initial isocratic hold segment equal to ΔtD before initiating the linear gradient profile compensates for the lower fluidic volume of the receiving system. When scientifically justified and consistent with applicable USP requirements, this adjustment can help maintain critical-pair peak resolution (Rs ≥ 1.8) without changing the fundamental separation chemistry or automatically requiring a post-approval regulatory supplement. The suitability of the adjustment must be confirmed experimentally and documented through the applicable change-control process.
Explore pharmaceutical CDMO services across the US and Canada for support with analytical testing and facility transitions.
Executing Method Re-Validation Under ICH Q2(R2) and ICH Q14 Standards
Re-validation under ICH Q2(R2) and ICH Q14 establishes scientific evidence that an analytical procedure consistently meets predefined quality criteria across its reportable range at the receiving facility. These modern guidelines emphasize risk-based analytical procedure development, clearly defined System Suitability Testing (SST), and predefined Analytical Target Profiles (ATP), where applicable.
Specificity and Forced Degradation Profiling
Specificity is evaluated by demonstrating that target analytes can be unequivocally distinguished from excipients, process impurities, and degradation products. Forced degradation studies expose drug substances and drug products to deliberately selected stress conditions to generate representative degradation profiles.
The following conditions illustrate a typical forced degradation study design. Actual conditions should be selected and adjusted according to the characteristics of the product, the intended analytical procedure, and the study objectives.
- Acidic Hydrolysis: Exposure to 1.0 N HCl at 60°C for 6 hours.
- Basic Hydrolysis: Exposure to 1.0 N NaOH at 60°C for 6 hours.
- Oxidative Degradation: Exposure to 3% H2O2 at ambient temperature for 24 hours.
- Thermal Stress: Storage under solid-state conditions at 80°C for 7 days.
- Photolytic Exposure: High-intensity exposure delivering at least 1.2 × 10⁶ lux·hours of visible light and at least 200 W·hours/m2 of ultraviolet energy.
Photodiode array (PDA) detection and mass spectrometry (MS) spectral purity analysis help establish whether the primary analyte peak remains spectrally homogeneous, with the Purity Angle below the Purity Threshold, and whether co-eluting degradation products are present. These assessments support specificity evaluation, although spectral purity results alone may not conclusively exclude all forms of co-elution.
Learn about peptide analytical characterization services for comprehensive evaluation of complex pharmaceutical molecules.
Linearity, Range, and Accuracy/Precision Evaluation
Linearity is assessed across the reportable range, typically spanning 0.05% to 1.5% for related substances and 50% to 150% of the nominal concentration for assay procedures, depending on the method’s intended use and applicable acceptance criteria. Accuracy and precision are evaluated using spiked matrix recovery samples and repeatability studies conducted over multiple days, where appropriate.
The following table summarizes the validation parameters, experimental designs, statistical evaluations, acceptance criteria, and illustrative results obtained during method re-validation.
| Validation Parameter | Experimental Design | Statistical Evaluation | Acceptance Criteria | Demonstrated Result |
|---|---|---|---|---|
| Specificity / Peak Purity | Forced degradation samples analyzed using PDA / MS. | Comparison of spectral purity angle against the purity threshold. | Peak purity must pass under all evaluated stress conditions, with no unacceptable co-elution. | Conforms; spectral homogeneity verified. |
| Linearity (Impurity) | Six concentration levels spanning 0.05% to 1.5%. | Correlation coefficient (r), y-intercept bias, and residual analysis. | r ≥ 0.999; y-intercept within ±2.0% of nominal. | r = 0.9998; y-intercept bias = 1.2%. |
| Accuracy (Recovery) | Matrix spiked at 50%, 100%, and 150% (n = 3 per level). | Mean percentage recovery and 95% confidence interval (CI). | Mean recovery of 98.0%–102.0% for assay and 85%–115% at the LOQ. | Overall recovery of 99.2%–101.1%; CI = 98.5%–101.8%. |
| Repeatability | Six replicate preparations at 100% concentration. | Relative standard deviation (%RSD). | %RSD ≤ 1.0% for assay and ≤ 5.0% for impurities. | %RSD = 0.42% for assay and 1.15% for impurities. |
| Intermediate Precision | Twelve preparations involving two analysts, two instruments, and two days. | Overall %RSD across combined operational variables. | Overall %RSD ≤ 2.0% for assay and ≤ 10.0% for impurities. | Total %RSD = 0.88% for assay and 2.04% for impurities. |
| Limit of Quantitation (LOQ) | Signal-to-noise (S/N) ratio approach and low-level precision assessment. | Signal-to-noise ratio and precision at the target LOQ. | S/N ≥ 10; %RSD ≤ 10.0% at the LOQ level. | LOQ = 0.03%; %RSD = 3.2% at the LOQ. |
Robustness and Method Operable Design Range (MODR)
Including robustness testing during re-validation helps identify critical operational parameters that can influence analytical method reliability. Systematically varying column temperature (±2.0°C), mobile phase pH (±0.1 pH unit), organic composition (±2.0% relative), and flow rate (±0.05 mL/min) can help establish a Method Operable Design Range (MODR).
Operating within a scientifically established MODR can support lifecycle management by defining acceptable operating conditions and the associated controls. This approach may reduce the need for additional regulatory submissions when minor routine adjustments are made within an approved or otherwise appropriately established range. However, the regulatory reporting category depends on the applicable filing commitments, regional requirements, and the nature of the proposed change.
Review peptide drug development through a CDMO to understand how analytical controls support development programs involving complex molecules.
Data Harmonization, Deviation Handling, and Acceptance Criteria Verification
Data harmonization and deviation investigations ensure that analytical variations, out-of-trend recovery anomalies, and inter-laboratory bias are evaluated statistically against pre-approved acceptance criteria. Addressing technical deviations during protocol execution protects data integrity and supports compliance with global quality standards.
During intermediate precision testing at the receiving laboratory, a minor low-recovery anomaly was observed for a specific degradation product. A root-cause investigation identified the following findings:
- Hardware Evaluation: Flow cell dispersion, pump mixing ripple, and detector linearity were assessed and found to meet the applicable operational specifications, ruling out instrument failure as the likely cause.
- Sample Handling Investigation: Analyte interaction studies revealed that the low-level degradant adsorbed onto standard borosilicate glass autosampler vials during extended analytical runs.
- Corrective Action: Replacing the glass vials with deactivated polypropylene vials eliminated the observed analyte adsorption under the evaluated conditions. Mean spiked recovery returned to 99.5%, with %RSD below 2.0%.
To confirm transfer success, comparative dataset evaluations used two-sided 90% and 95% confidence intervals to assess differences between sample means from the outgoing CDMO and the receiving facility. The resulting statistical evaluation indicated that inter-laboratory assay bias remained within the pre-approved ±1.5% limit, while impurity levels showed no statistically significant differences under the study conditions. These findings supported the conclusion that the analytical method performed comparably at the receiving facility against the predefined transfer criteria.
Examine this generic peptide analytical characterization case study for an example of analytical assessment in complex drug development.
Regulatory Filing Strategy and Post-Transfer Lifecycle Control
Updating Common Technical Document (CTD) Module 3 regulatory filings aligns the new CDMO’s testing capabilities with global registration dossiers while incorporating the lifecycle change-control principles described in ICH Q14. The completed re-validation protocol, executed data package, and comparative statistical report provide the technical foundation for the necessary dossier updates.
- CTD Section 3.2.S.4.3 / 3.2.P.5.3 (Validation of Analytical Procedures): Updated to incorporate the re-validation study conducted in accordance with applicable ICH Q2(R2) principles and the analytical procedure lifecycle framework described in ICH Q14.
- CTD Section 3.2.S.4.1 / 3.2.P.5.1 (Specification / Control Strategy): Reviewed and updated, where necessary, to reflect the standardized System Suitability Test (SST) parameters and MODR boundaries established at the receiving site.
Under the enhanced analytical procedure lifecycle framework described in ICH Q14, operational adjustments within a predefined MODR may be managed through the facility’s Pharmaceutical Quality System (PQS), provided that the approach is scientifically justified and consistent with applicable regulatory commitments. Depending on the change and the relevant jurisdiction, this strategy can reduce the need for prior-approval regulatory supplements and lower the ongoing maintenance burden following a CDMO transition.
Explore peptide CDMO services for analytical and development support across the pharmaceutical product lifecycle.
Conclusion
A rigorous approach to Analytical Method Transfer and Re-Validation enables pharmaceutical sponsors to transition between CDMOs while minimizing compliance gaps and supply chain disruptions. By conducting comprehensive gap analyses, addressing hardware variations such as dwell volume differences, and performing re-validation in accordance with ICH Q2(R2) and ICH Q14 principles, laboratories can establish audit-ready analytical methods that safeguard drug quality throughout commercial manufacturing.
Partnering with an experienced analytical testing facility helps ensure that method transfers, technical troubleshooting, and regulatory documentation are managed systematically, efficiently, and in accordance with applicable quality requirements.
See how peptide characterization and analytical testing can support robust analytical strategies for complex pharmaceutical products.
To discuss specialized analytical technology transfers, method re-validation, or complex chromatographic troubleshooting, consult the expert team at ResolveMass Laboratories Inc. Visit the Contact Page.
Frequently Asked Questions (FAQs)
USP guidance on analytical procedure transfer addresses the process of demonstrating that a receiving laboratory can successfully perform an established analytical method, often through comparative testing or other scientifically justified approaches. USP verification focuses on confirming that a laboratory can properly perform an applicable official compendial procedure under its specific operating conditions. The appropriate approach depends on whether the method is compendial, non-compendial, or subject to additional regulatory requirements.
Dwell volume determines how long a change in mobile phase composition takes to reach the HPLC column after the gradient program begins. Differences between instruments can shift retention times, affect peak separation, and cause closely eluting compounds to overlap. Evaluating dwell volume and making scientifically justified adjustments to gradient timing can improve comparability while preserving the intended separation mechanism.
Full re-validation may be necessary when substantial changes to analytical procedures, instrument technology, or critical operating conditions could affect method performance. It may also be appropriate when historical validation records from the outgoing CDMO are incomplete or unavailable. The final decision should be based on a documented risk assessment, existing validation evidence, the nature of the changes, and applicable regulatory expectations.
ICH Q2(R2) establishes principles for validating analytical procedures, including characteristics such as specificity, accuracy, precision, and linearity, where applicable. ICH Q14 complements these principles by addressing analytical procedure development, risk management, and lifecycle considerations. Together, they provide a science-based framework for establishing reliable methods, evaluating changes, and maintaining analytical performance throughout the product lifecycle.
Sample preparation differences should be identified through a structured gap analysis before formal transfer studies begin. Important variables include extraction time, vortexing speed, sonication power, filtration materials, and sample container compatibility. Documenting and standardizing these parameters in updated SOPs helps reduce variability in analyte recovery and improves reproducibility between laboratories.
Comparative analytical transfer studies may use mean differences, relative standard deviation (%RSD), appropriate hypothesis tests, and confidence intervals to assess agreement between laboratories. Equivalence testing can help determine whether observed differences fall within predefined, scientifically justified acceptance limits. The statistical approach should reflect the analytical method, sample design, variability, and transfer protocol requirements.
Switching between Chromatography Data Systems (CDS), such as Empower, Chromeleon, and LabSolutions, may affect data processing through differences in peak integration settings, baseline detection, and calculation procedures. During method transfer, laboratories should compare processing parameters, integration rules, system suitability calculations, and reporting outputs. Documenting these checks helps maintain consistency, traceability, and data integrity across software environments.
An analytical method transfer waiver is a documented, risk-based justification for not conducting conventional comparative transfer testing. It may be considered when sufficient evidence demonstrates that the receiving laboratory is already qualified to perform the procedure or when applicable compendial requirements support a verification-based approach. The decision must be scientifically justified, approved through the appropriate quality system, and consistent with applicable regulatory expectations.
Following an analytical method transfer, the sponsor evaluates the relevant CTD Module 3 sections to determine whether updates to validation data, analytical procedures, specifications, or control strategies are necessary. Sections 3.2.S.4.3 and 3.2.P.5.3 may require revisions to reflect updated validation or re-validation evidence. Any submission, variation, supplement, or annual reporting requirement depends on the nature of the change, the applicable jurisdiction, and the product’s existing regulatory commitments.
Reference:
- International Council for Harmonisation of Technical Requirements for Pharmaceuticals for Human Use. (2022, March 24). Q14: Analytical procedure development and Q2 (R2): Validation of analytical procedures [Presentation]. https://database.ich.org/sites/default/files/Q2_Q14%20ICH_Step_2_Presentation_2022_0325.pdf
- International Council for Harmonisation of Technical Requirements for Pharmaceuticals for Human Use. (2025, July 8). ICH Q2(R2): Validation of analytical procedures—Training Module 2: Fundamental principles of ICH Q2(R2) [Training presentation]. https://database.ich.org/sites/default/files/ICH_Q2%28R2%29Q14_TrainingMat_Module%20_2_2025_0620.pdf
- International Council for Harmonisation of Technical Requirements for Pharmaceuticals for Human Use. (2023, November 6). Q2(R2): Validation of analytical procedures and Q14: Analytical procedure development [Presentation]. https://database.ich.org/sites/default/files/Q2_Q14%20ICH_Step_4_Presentation_2023_1106_0.pdf
- International Council for Harmonisation of Technical Requirements for Pharmaceuticals for Human Use. (2023). ICH harmonised guideline: Validation of analytical procedures Q2(R2). https://database.ich.org/sites/default/files/ICH_Q2%28R2%29_Guideline_2023_1130.pdf
- International Council for Harmonisation of Technical Requirements for Pharmaceuticals for Human Use. (2022, March 24). ICH harmonised guideline: Validation of analytical procedures Q2(R2). https://database.ich.org/sites/default/files/ICH_Q2-R2_Document_Step2_Guideline_2022_0324.pdf
- European Medicines Agency. (n.d.). ICH Q2(R2) validation of analytical procedures. https://www.ema.europa.eu/en/scientific-guidelines/ich-q2r2-validation-analytical-procedures
Get In Touch With Us
About The Author